
The market has now rallied for 13 trading bars from the March 30 low to the April 17 high. We have not seen a move quite like this since January 1992, roughly 34 years ago. Interestingly, 34 years also reflects an 11.5-year cycle multiplied by three. To me, this is another example of how past cycles continue to echo into the future.
Planetary Aspects
Several planetary aspects are taking place this weekend that could trigger a market reversal on Monday. It could be a sharp decline. My view is that this is a top, though probably not the final top.
April 19
- Mars and Saturn form a conjunction (powerful).
- The longitudinal speed of the Moon’s North Node is changing.
- The longitudinal speed of the Moon is changing.
- Mercury’s declination is crossing above 0 degrees.
- The declinations of Mercury and Neptune are crossing each other.
- The Moon’s perigee occurs. Perigee is when the Moon’s orbit is closest to the Earth. It is interesting to note that perigee and apogee dates often correspond with tops and bottoms in Bitcoin, and frequently in the S&P as well.
April 20
- The Moon’s latitude is turning down from its maximum. Extreme maximum and minimum values are often associated with tops and bottoms.
- Mars and Mercury form a conjunction (powerful).
- Mercury and Saturn form a conjunction (powerful).
Pluto’s Planetary Trend Line
If we take the April 17 high of 7147 and divide it by 360 degrees, we get 19.852. We then take .852 and multiply it by 360 to obtain the actual longitudinal position on the zodiac circle. That comes to 306 degrees, which is where Pluto is currently located. Please refer to the chart below, where price meets this planetary level.
To go one step further, we can translate 7147 into 71 degrees 47 minutes. That longitudinal placement is exactly square with the Moon’s North Node. So as you can see, the price levels of pivot points are like DNA time capsules.

Pluto Planetary Longitudinal Line vs SPX
Why April 17 May Be a Top
I suspect April 17 is probably a top for the following reason.
The March 30 low was 6316 in the cash S&P. To convert that price into time, we can treat 6316 as degrees. Since the Earth rotates 1 degree every 4 minutes, and there are 1440 minutes in a day, we multiply 6316 degrees by 4 minutes per degree. That gives us 25,264 minutes. Dividing 25,264 by 1440 minutes per day gives us 17.5 days. Add 17 days to the March 30 low and we arrive at April 17. Prices clearly rallied into that time window.
We can also apply this to the January 28 top at 7002. Multiply 7002 by 4 and we get 28,008 minutes. Dividing 28,008 by 1440 gives us 19.45 days. If we then take 19.45 and multiply it by 4 cycles, we get 78 days. Add 78 days to January 28 and once again we arrive at April 17.
This type of relationship shows up repeatedly. Pivot points are connected to one another by decoding price into time. W.D. Gann always said that price and time are interchangeable, and that has been my experience as well. He had no computers to do this. One of my programs keeps track of these cyclical dates and shows me where the clusters are with the click of a mouse.
Here is another technique. Take the price 6316 and move the decimal point to make it 6.316. Multiply that by pi (3.14) and you get 20. Add 20 days to March 30 and you arrive at April 19, which is Sunday. Or convert 6316 into minutes. Divide by 60 and you get 105.2 hours, or 4.38 days. Four cycles of 4.38 days equals 17.5 days. Once again, adding 17 days to March 30 brings us to April 17.
These techniques will be covered in the book It’s About Time All the Time.
Future Harmonic Time Dates
Everything in the universe is highly geometric. I rely on astronomy, not astrology. I prefer a more scientific approach to data and less of an esoteric one.
So let’s do something interesting. If we take the range of price action from the January 28 high to the March 30 low, we get 61 days. I like to divide that period into 8 harmonic time segments. Refer to the chart below, where I projected that 61-day rectangle forward from the March 30 low. Each 1/8 division produces the following future pivot dates:
| Division | Date |
|---|---|
| 1/8 | 04/07 |
| 2/8 | 04/15 |
| 3/8 | 04/22 |
| 4/8 | 04/29 |
| 5/8 | 05/06 |
| 6/8 | 05/13 |
| 7/8 | 05/20 |
| 8/8 | 05/29 |
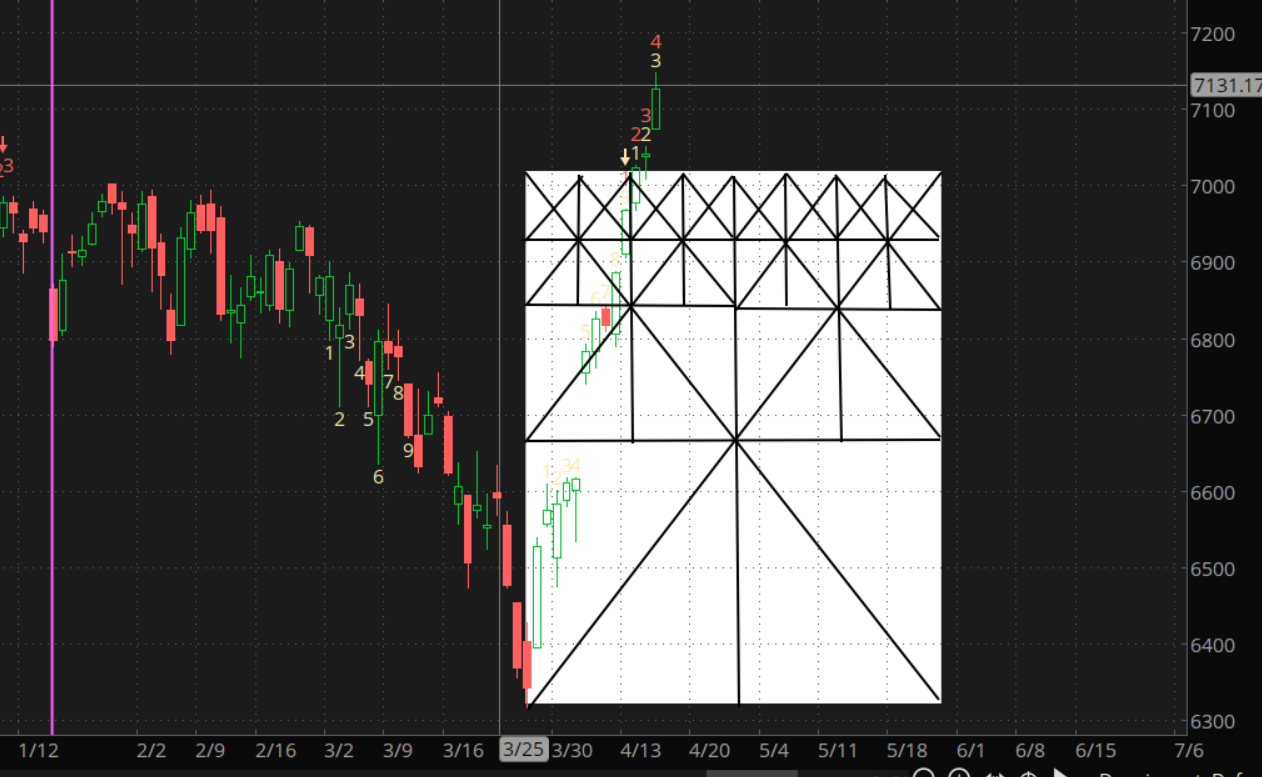
Time Range from Jan 28 2026 to March 30 2026
You can continue moving this time rectangle forward into the future to capture additional harmonic dates. I also took each 1/8 division and split it again in half, giving me 16 harmonic time divisions. April 17 falls between 2/8 and 3/8, or at 5/16.
As this unfolds, you begin to see that the market does not move as randomly as many people believe. In fact, this is how future trend lines are formed. That is mind-blowing. I am using rectangles from years ago and they still fit future market action. One example is the range from the February 19, 2025 high to the April 7, 2025 low. And I could go on and on with these ranges. Experiment with them and you may be amazed.
The chart below is another tool that I use in my analysis. I took the April 7th 2025 low and moved the Moon incrementally by a longitudinal displacement of 90 degrees. Each time the Moon moves 90 degrees there is a strong correlation of a market pivot (high/low). Click on the chart to download the Excel file from April 7 2025 to Dec 31 2026 and you should have all of the future dates from now to the rest of the year.

Moon 90 degrees Incremental Longitudinal Movement