
April 27–28, 2026: Short-Term Pivot High
Pullback Window into April 29/30

The current cycle work continues to point toward April 27–28, 2026 as an important short-term timing window. Since the S&P has rallied into this period, the probability increases that the market is forming some type of short-term pivot high, followed by a pullback into the April 29/30 time frame.
Several independent timing methods are clustering in this same area, including price-to-time conversions, lunar cycles, Fibonacci calendar counts, planetary longitude projections, and planetary aspect changes.
Pivot Prices Converted into Time
October 10, 2025 Low — 6550
One method is to convert the pivot price into months:
6550 = 6.55 months
Using the average calendar month:
6.55 × 30.427 days = approximately 200 days
Adding 200 calendar days to the October 10, 2025 low projects forward to:
April 28, 2026
This places the October 2025 low directly into the current April 27/28 timing cluster.
March 30, 2026 SPX Low — 6316
The March 30, 2026 low also produces several important time projections.
A sidereal lunar cycle is approximately 27 days.
Adding one sidereal lunar cycle to the March 30 low gives:
March 30 + 27 days = April 26, 2026
This aligns closely with the current timing window.
Now convert the March 30 price low of 6316 into degrees:
6316 degrees × 4 minutes per degree = 25,264 minutes
Then convert minutes into days:
25,264 ÷ 1,440 = 17.54 days
Adding approximately 18 days to March 30 projects to:
April 17, 2026
April 17 did produce a temporary high, followed by a four-day consolidation period.
A second cycle of 17.54 days projects forward to approximately:
May 4, 2026
This becomes another future date to monitor.
January 28, 2026 High
The January 28, 2026 SPX high also produces a strong cluster.
Adding 89 calendar days, a Fibonacci sequence number, projects to:
April 27, 2026
Adding 90 calendar days, which represents one-quarter of the 360-degree circle, projects to:
April 28, 2026
This gives another direct confirmation of the April 27/28 time window.
February 5, 2026 Low
From the February 5, 2026 low:
3 sidereal Moon cycles = approximately 82 days
Adding 82 calendar days projects to:
April 28, 2026
Again, we see another independent timing method landing on the same April 27/28 cluster.
Converting Price into Time
March 30, 2026 SPX Low — 6316
Another way to convert the March 30 low into time is by treating the price as hours:
6316 = 631.6 hours
Then:
631.6 ÷ 24 = approximately 26 days
Adding 26 days to March 30 projects to:
April 25, 2026
This represents another time square-out from the March 30 pivot low.
The same price can also be converted into minutes:
6316 minutes ÷ 60 = 105 hours
Then:
105 ÷ 24 = 4.4 days
Using five cycles of 4.4 days gives:
5 × 4.4 = 22 days
Adding 22 days to March 30 projects to:
April 21, 2026
April 21 was an important short-term low, creating another time square-out from the March 30 pivot.
April 23, 2026 Low — 7046
The most recent price low on April 23, 2026 was near 7046.
Convert 7046 into minutes:
7046 minutes ÷ 60 = 118 hours
Then:
118 ÷ 24 = approximately 5 days
Adding 5 days to April 23 projects to:
April 28, 2026
This gives another price-to-time confirmation of the April 27/28 pivot window.
Converting Price into Longitude
The April 23, 2026 low can also be converted into longitude.
Using the price 7046 as 70.46 degrees, and adding that amount to the Moon’s longitude on April 23, projects forward to:
April 29, 2026
This suggests that April 29 may act as a short-term square-out date, possibly marking the pullback low following the April 27/28 pivot high.
Square Root Price-to-Longitude Projections
January 28, 2026 SPX High — 7002
Taking the square root of the January 28 high:
√7002 = approximately 84 degrees
Using heliocentric Venus:
Venus at 321 degrees + 84 degrees = May 13, 2026
This date also aligns with the 1/8 harmonic structure measured from the March 30, 2026 low to the May 30, 2026 projection window.
The January 28 to March 30 range is 61 calendar days. When that 61-day range is divided into eighths, May 13, 2026 falls near the 3/4 harmonic point, making it an important future energy date.

March 30, 2026 SPX Low — 6316
Taking the square root of the March 30 low:
√6316 = approximately 80 degrees
Using heliocentric Mercury:
Mercury at 245 degrees + 80 degrees = April 26, 2026
Then adding a second 80-degree cycle projects to:
May 13, 2026
This agrees with the Venus projection from the January 28 high.
Using heliocentric Venus from the March 30 low:
Venus at 58 degrees + 80 degrees = May 19, 2026
This becomes another important future energy point, falling between the 3/4 and 7/8 time harmonics of the current range under study.
Prior Range Geometry Confirmation
Another important historical relationship comes from the February 2025 high to the April 7, 2025 low.
That range measured:
47 calendar days
Extending that 47-day structure forward from the April 7, 2025 low:
8 cycles of 47 days = April 17, 2026
April 17 did become a temporary high.
The 9th cycle of that same structure projects to:
June 4, 2026
This date should be watched as another future energy point, especially when combined with the current 61-day range projections from January 28 to March 30, 2026.
Lunar and Proprietary Cycle Cluster
The lunar time cycle and my proprietary cycle both identify:
April 26, 2026
as an important pivot date.
Since April 26 fell on a Sunday, the practical trading-day impact shifts into:
Monday, April 27, 2026
With price rallying into this window, the evidence suggests that the market is likely forming some type of short-term top.
Those same two cycles then align again around:
April 29/30, 2026
This suggests that the pullback may continue into that window before another short-term pivot develops.
Planetary Aspect Cluster
Several planetary changes also occur during this same timing window.
April 24, 2026
- Neptune declination crosses above zero.
- Pluto and the Sun form a square.
- Venus moves into Gemini.
April 25, 2026
- The longitudinal speed of the Moon’s North Node changes.
- Jupiter and Mercury form a square.
April 26, 2026
- The Moon’s latitude crosses below zero.
- The Sun’s latitude crosses below zero.
- Uranus moves into Gemini.
This concentration of planetary activity adds further weight to the April 26–28 period.
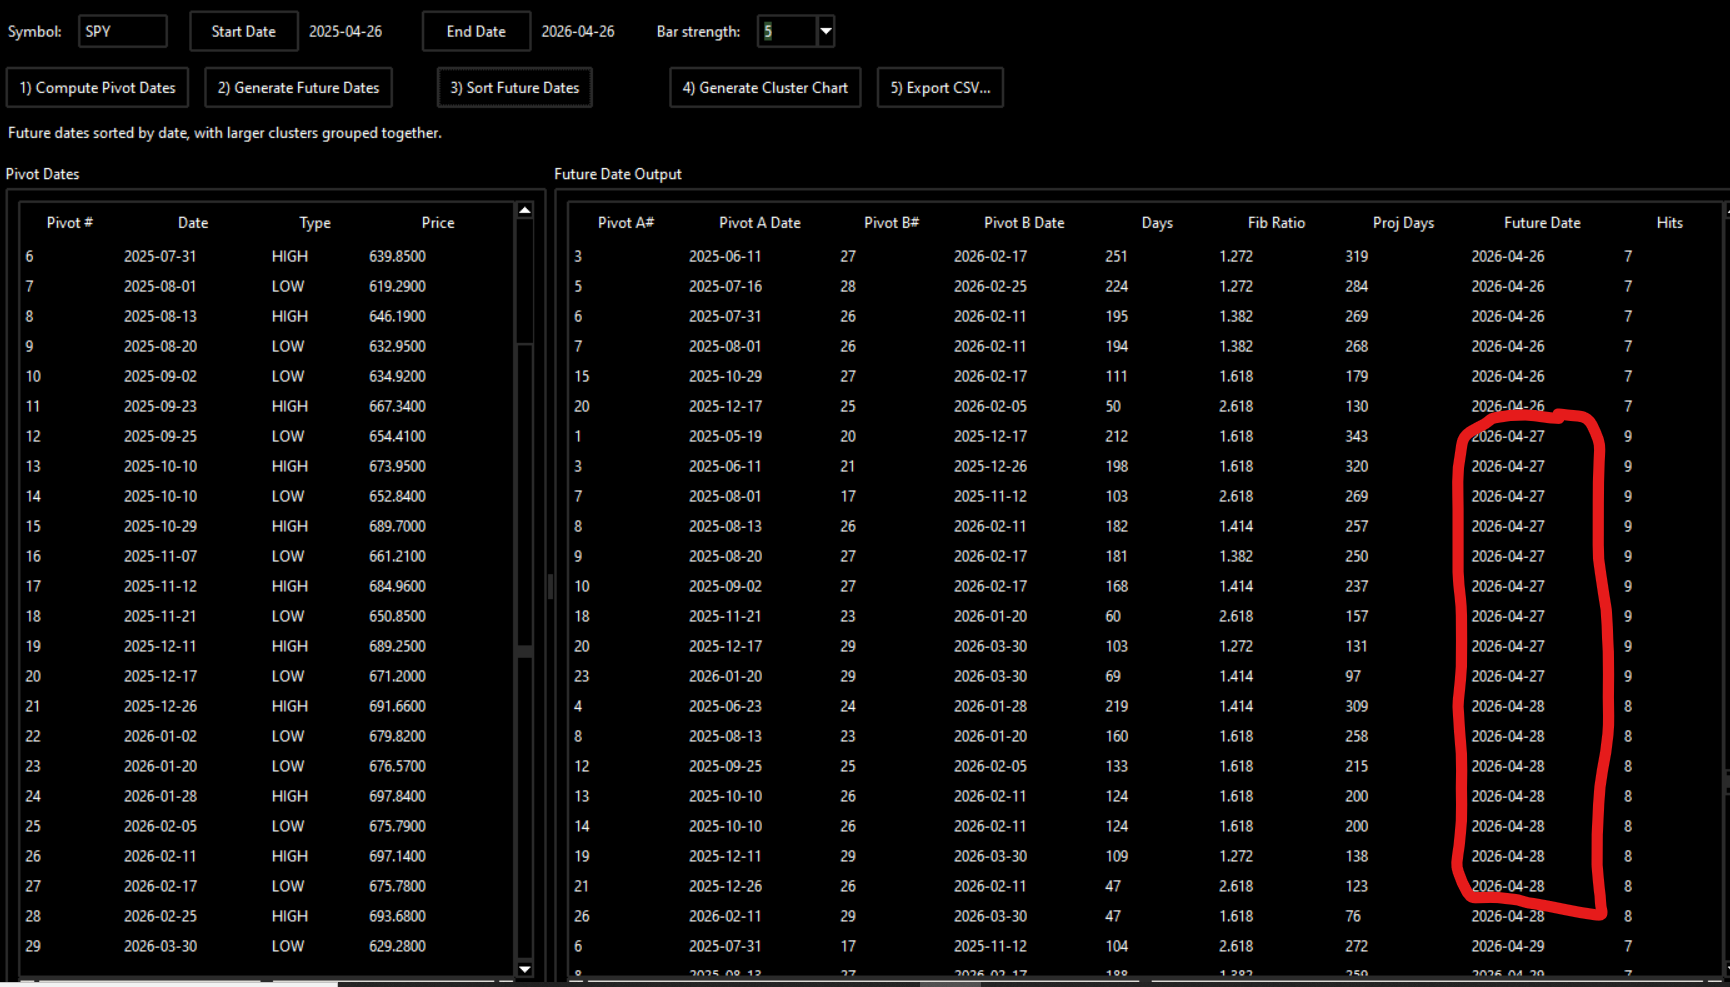
Fibonacci Time Expansion Cluster
There is also a strong cluster of Fibonacci time expansions occurring around:
April 27/28, 2026
Using prior pivot points, I identify pivots based on a defined bar strength, using trading bars on each side of the pivot. From there, I compare all possible pivot relationships and extend those relationships forward using the Fibonacci expansion ratios:
1.27, 1.382, and 1.618
The purpose is to identify future dates where multiple expansion relationships cluster together.
The current cluster is very strong around Monday/Tuesday, April 27/28, suggesting that something important is taking place in this time window.
Conclusion
The evidence continues to point toward April 27–28, 2026 as an important short-term pivot window. Since the market has rallied into this period, the expectation is for some type of short-term high to form, followed by a pullback into the April 29/30 time frame.
The April 27/28 cluster is supported by:
- Price-to-time conversions
- Sidereal lunar cycle counts
- Fibonacci calendar counts
- 360-degree circle divisions
- Square root price-to-longitude projections
- Heliocentric Mercury and Venus projections
- Planetary aspect changes
- Fibonacci time expansion clusters
When several independent timing methods converge in the same narrow window, that period deserves close attention. In this case, the April 27/28 window appears to be a key short-term energy point, with April 29/30 likely marking the next important pivot area.