
Market Update — June 6, 2026
In my last market update, I made a very important distinction about June 1, 2026. I said that June 1 was more than just another pivot date. The reason was simple: the master square was coming into the end of its range, and the end of a completed time range will often mark an important change in trend.
That is exactly why I was watching that date so closely. When a market arrives at the end of a major time square, especially when other timing tools are confirming the same area, it becomes a date that deserves attention.
There were several other factors supporting June 1 as well. The North Node changed longitudinal speed on May 31, and the Moon’s longitudinal speed also changed on May 31. These speed changes are important because they often appear near meaningful market turns. When they occur at the same time a master square is completing, the evidence becomes much stronger.
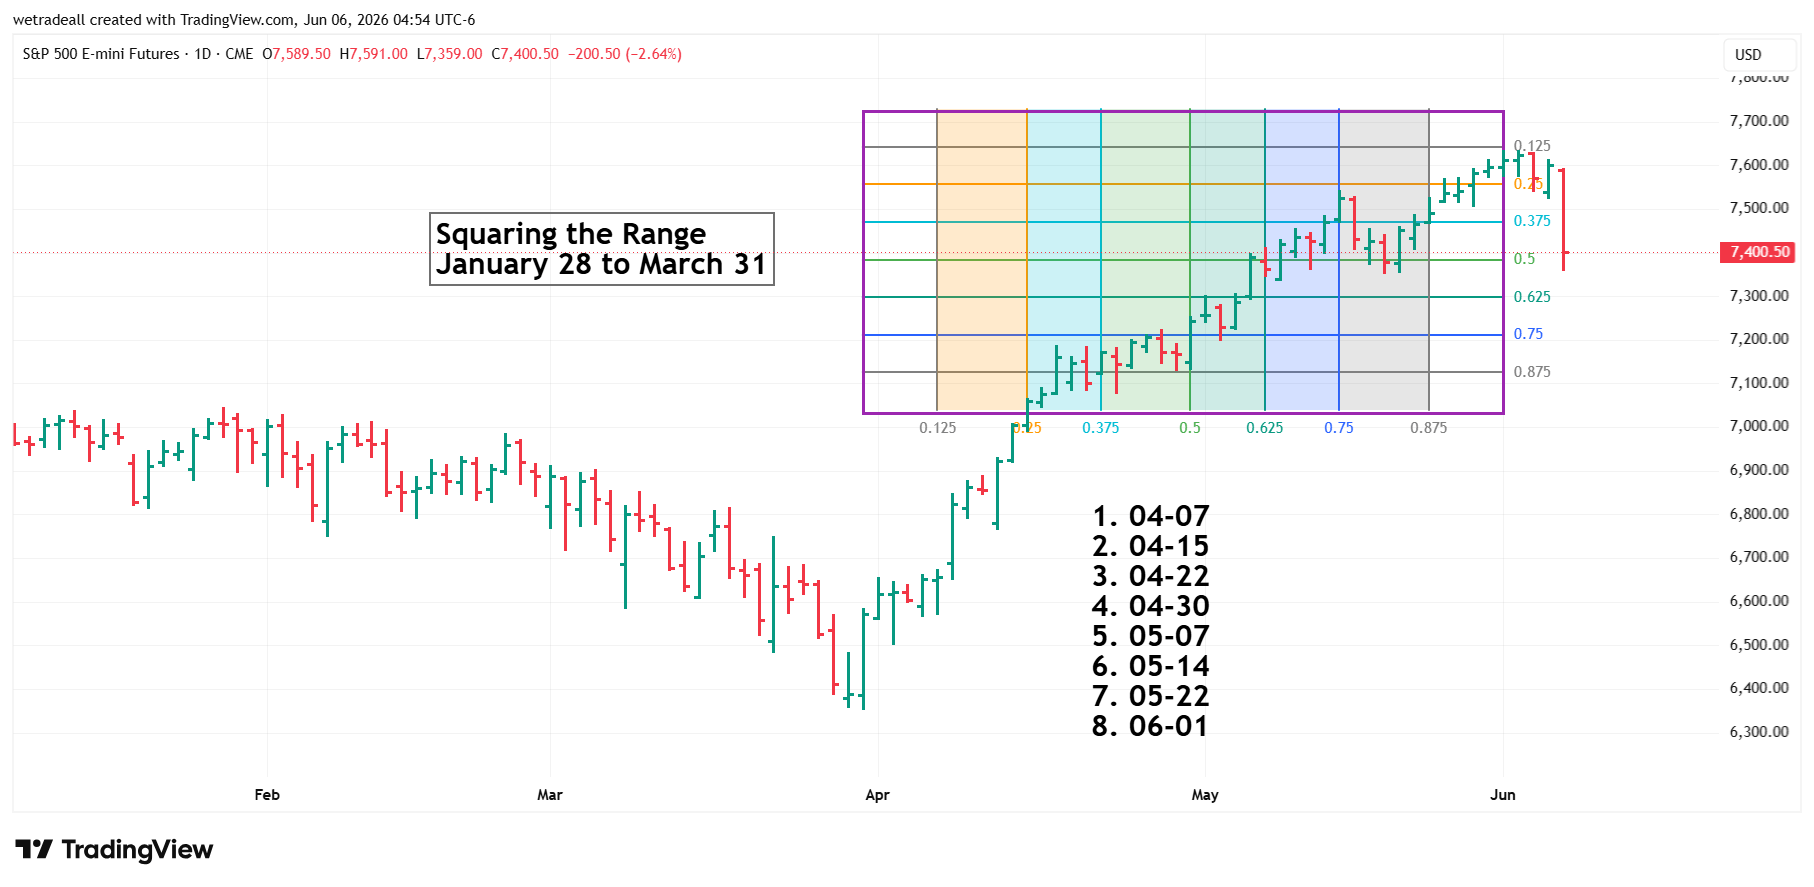
Figure A. Price reverses at the end of the Master Square on June 1, 2026.
The February 19, 2025 Pivot Still Points to June 2026
Another important confirmation comes from the February 19, 2025 high pivot. The price at that pivot was 6166. When 6166 is converted into longitude degrees and entered into the Future Longitude Date Finder, the Moon transits that number of degrees and arrives on June 2, 2026.
That is very important because June 2 is the day immediately after the completion of the primary square. This is another example of something I discuss throughout my book: price pivots often hide time. Price is not always just price. A pivot price can contain a time code. When that price is converted into longitude, and longitude is then applied to planetary motion, price becomes a timing mechanism.
That is why I keep saying that longitude is time when it is applied to planetary transits.

Figure C. Future Longitude Date Finder.
The Master Square Has Now Shifted Forward
After the June 1 completion, I shifted the master square forward in time and began the process again. The new projected time points from the shifted square are:
- June 8
- June 16
- June 24
- July 2
- July 10
- July 17
- July 24
- August 3
The 2nd, 4th, 6th, and final points of the square are usually the most important dates to watch. On Friday, the market declined into the 4th minor square support zone from the prior master square. The low price was 7359. When that price is converted into longitude, it becomes 73.59 degrees.
That degree is important because it placed price directly on top of the Sun’s longitude on the zodiac chart. In market timing work, conjunctions often appear near price reversals. That does not mean every conjunction produces a reversal, but when the geometry and timing are already lined up, it becomes another confirmation.
We are now moving into June 8, which is the first minor square of the newly shifted master square. That makes June 8 an important date to watch for a possible reversal or pivot low.
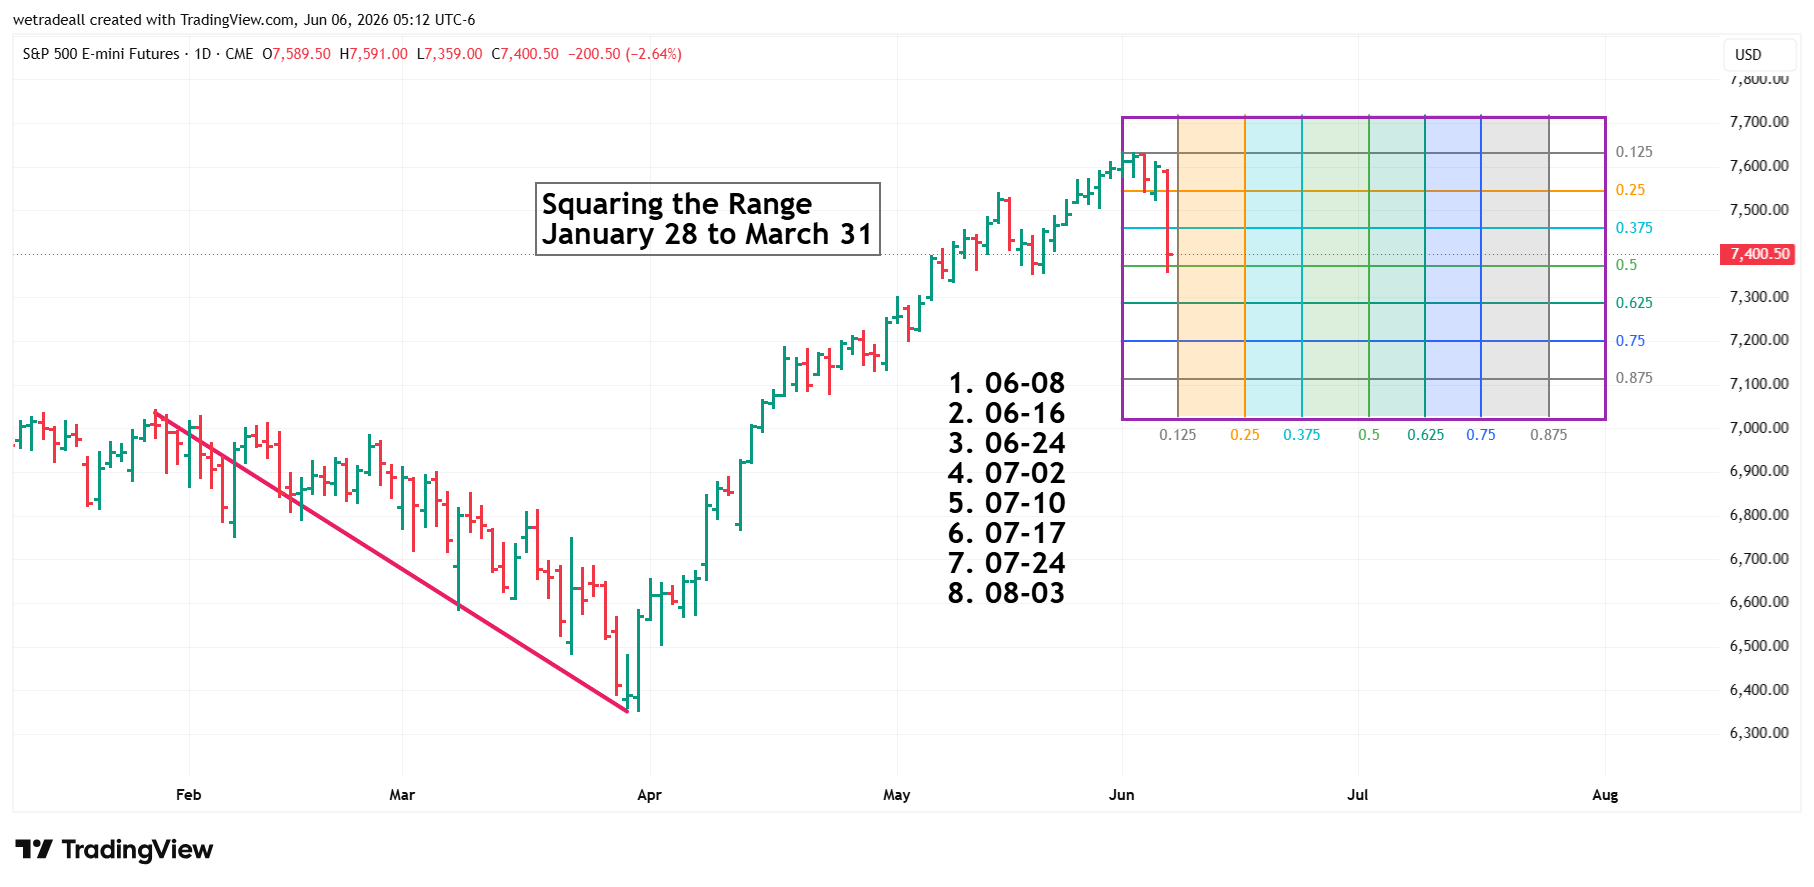
Figure B. Master Square shifted to the right.
Moon and North Node Speed Changes Confirm the June 7–8 Window
Figure D shows the Moon’s longitudinal speed changing on June 7. Figure H shows the North Node also changing longitudinal speed on June 7. This creates another important timing cluster right in front of the June 8 minor square.
When a minor square date, a Moon speed change, and a North Node speed change all appear in the same small time window, that date becomes much more important than a normal trading day. This is the type of timing cluster I look for each week.

Figure D. Moon Longitudinal Speed.
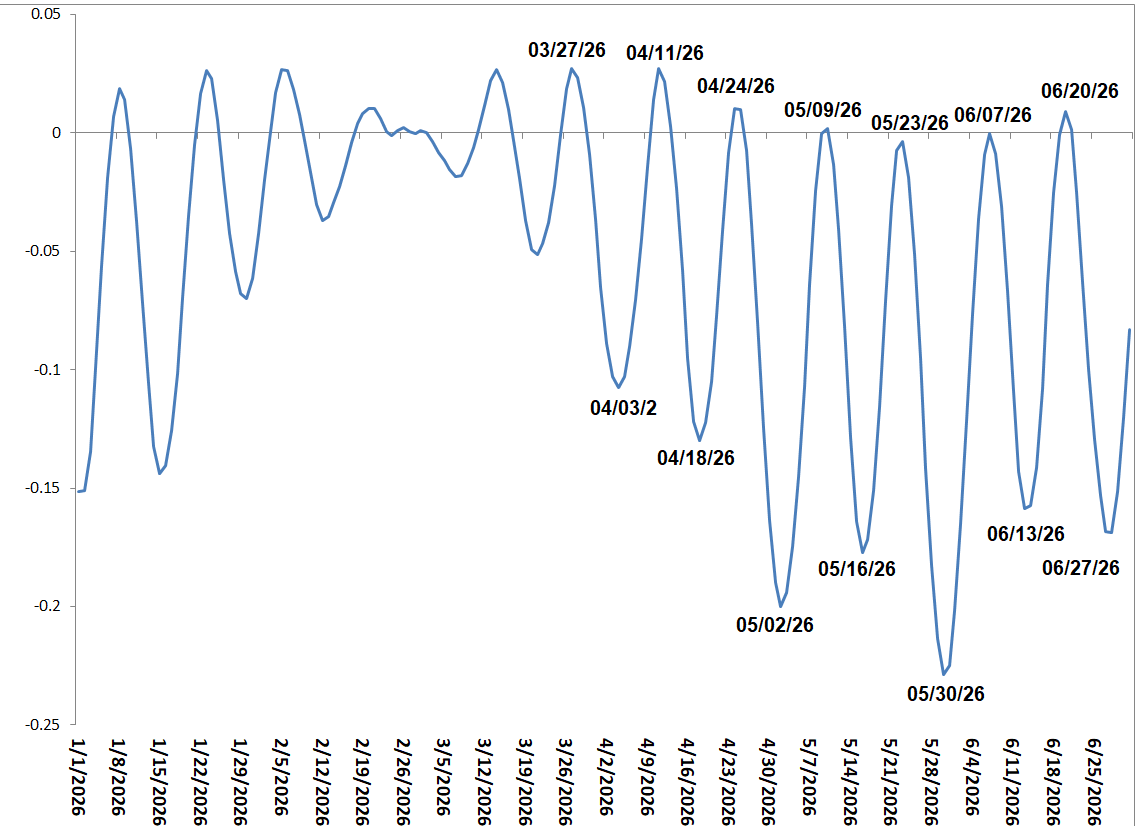
Figure H. North Node of the Moon Longitudinal Speed.
The January 28, 2026 High Converts into Future Time
Now let’s go back to the January 28, 2026 high, where the e-mini futures price was 7043. When 7043 is converted into longitude, it becomes 70.43 degrees.
Using the Longitude Finder, the Moon reaches that projected longitude date on July 16, 2026. That is very close to the 6th minor square, or three-fourths of the primary square. Once again, price has been converted into longitude, and longitude has been converted into time.
We can also use heliocentric Mercury and heliocentric Venus to project future dates from the same 70.43-degree value. Notice how these planetary cycles land directly on, or very near, the minor square divisions:
- Mercury: 8 cycles × 70.43 = 563 degrees = June 8, 2026 — 1st minor time square
- Mercury: 9 cycles × 70.43 = 634 degrees = June 25, 2026 — near the 3rd minor time square
- Mercury: 10 cycles × 70.43 = 704 degrees = July 18, 2026 — near the 6th minor time square
- Mercury: 11 cycles × 70.43 = 774 degrees = August 4, 2026 — near the end of the primary square
- Venus: 3 cycles × 70.43 = 212 degrees = June 8, 2026 — 1st minor time square
This is exactly what I want to see. I am not looking for one isolated timing method. I am looking for several independent methods that keep pointing to the same future dates.
The March 30, 2026 Low Adds More Confirmation
We can also use the March 30, 2026 low at 6359. When that price is converted into longitude, it becomes 63.59 degrees. Using Mercury cycles from that value, we get the following dates:
- Mercury: 5 cycles × 63.59 = 318 degrees = June 15, 2026 — near the 2nd minor time square
- Mercury: 6 cycles × 63.59 = 381 degrees = July 3, 2026 — near the 4th minor time square
Again, the same future time windows keep appearing. This is why these dates matter. The market is producing the geometry, and the planetary transits are helping reveal the time.
Lunar Time Cycle Confirmation
The Lunar Time Cycle shown in Figure F gives additional confirmation. Several of the lunar cycle dates land directly on, or very close to, the minor square dates. This gives us another layer of evidence that the geometry is active.
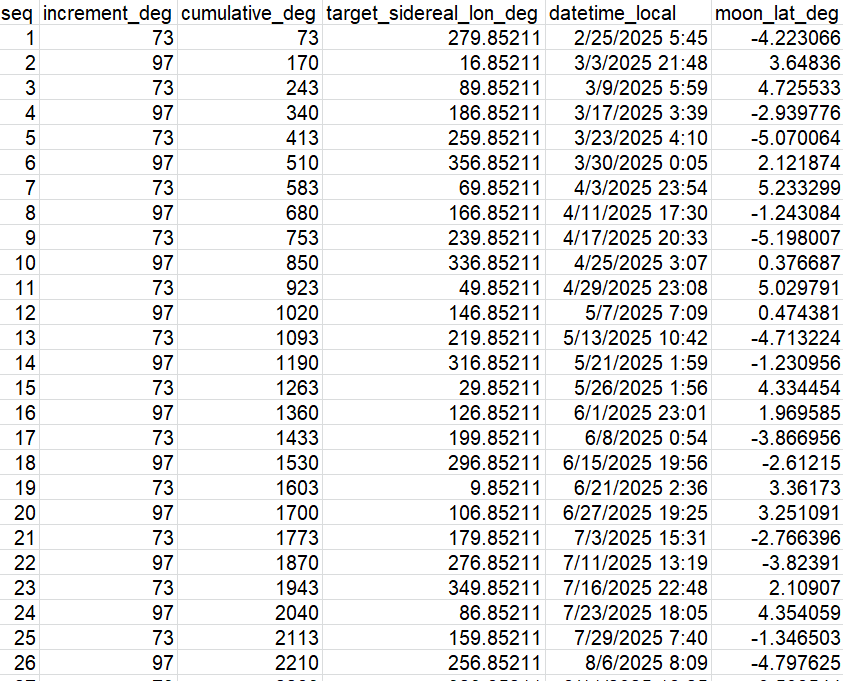
Figure F. Lunar Time Cycle.
Using the Square of Nine as a Calendar
Figure E and Figure G are powerful tools when used as time locators in calendar days. Figure E was generated from the Square of Nine App. In this example, I used the March 30, 2026 low as the center point of the Square of Nine chart shown in Figure G.
From that center point, I rotate clockwise and watch for dates that land on the cardinal cross or the 45-degree diagonal lines. Those dates are then recorded by the software app and exported into a CSV file.
The program can also identify other important pivot points and repeat the same process from those dates. What matters here is that the Square of Nine dates continue to land on the same minor time squares, all the way into the end of the primary square on August 3.

Figure E. Square of Nine dates with the March 30, 2026 pivot.

Figure G. Square of Nine chart used as time.
The Main Point
My weekly analysis after running all of these apps could easily fill a book. But the basic idea is not complicated. I am looking for clusters of time where several different methods point to the same future dates.
That is where the real value is. One timing method by itself can be interesting. But when the master square, planetary longitude, lunar timing, speed changes, and Square of Nine dates all begin to cluster around the same dates, those dates become much more important.
This work is all based on geometry. Once you learn how to read the geometry, future forecasts become much easier to identify.
All of the apps I use in this analysis are available in the software store at AstroTimeCycles.com.