
Market Update: June 15, 2026
Multiple Time-Cycle Signals Cluster Around Mid-June
Several important planetary, price, and time-cycle factors are lining up around June 15, 2026.
Taken together, they suggest that the S&P may be in the process of forming a short-term top,
or at least reaching an important point of inflection.
The important point is not any single indicator by itself. The key is the cluster. When several
independent timing methods begin pointing to the same narrow window, that is when the market
deserves closer attention.
Key Factors Now in Play
- The declinations of the Sun and Mercury have crossed over.
- The Moon’s longitudinal speed has changed.
- Mercury’s longitudinal speed has crossed an important 59-degree reference point.
- The Moon’s declination has changed.
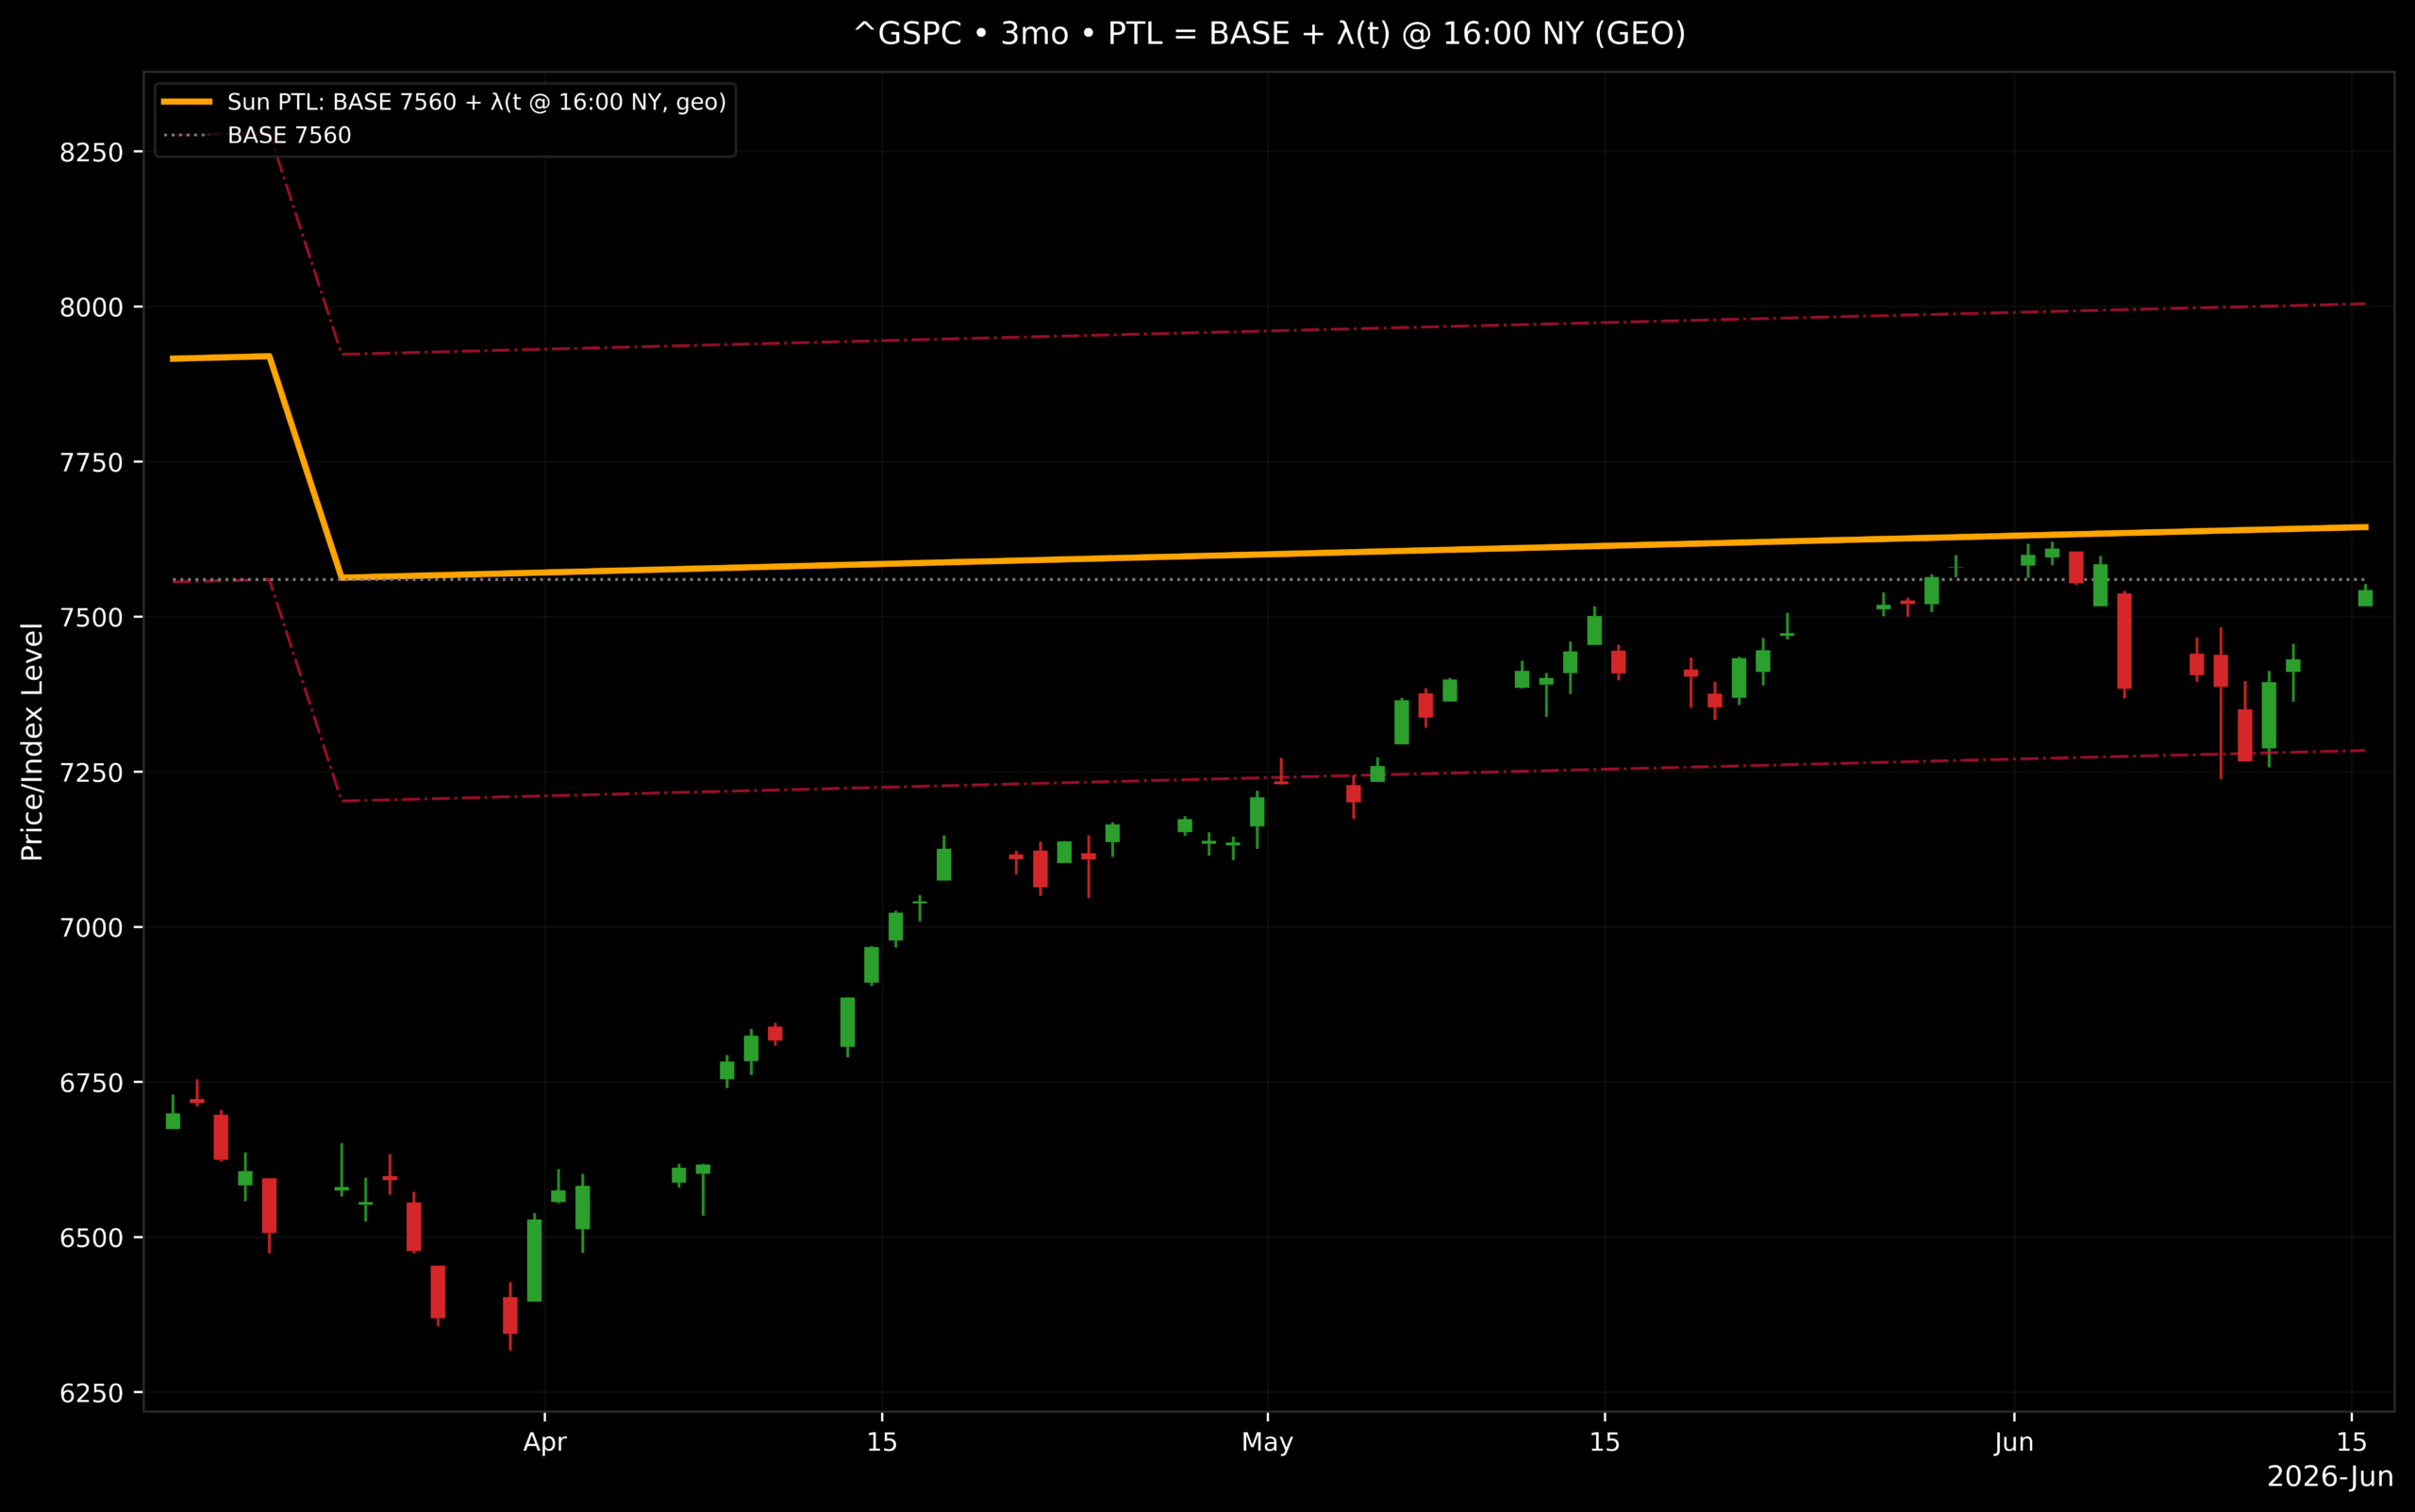
- The Sun planetary line chart shows price reaching resistance near the Sun’s planetary line.
- A Fibonacci time-zone extension from the January 28, 2026 pivot to the March 30, 2026 low reaches the 2.272 extension on June 15, 2026.
The Mercury longitudinal speed factor is especially interesting. George Bayer and W.D. Gann both
paid close attention to planetary motion as a point of market inflection. In this case, Mercury is
crossing a significant 59-degree reference area, which has proven to be a credible timing marker
in prior work.
Square of Nine Time Setup
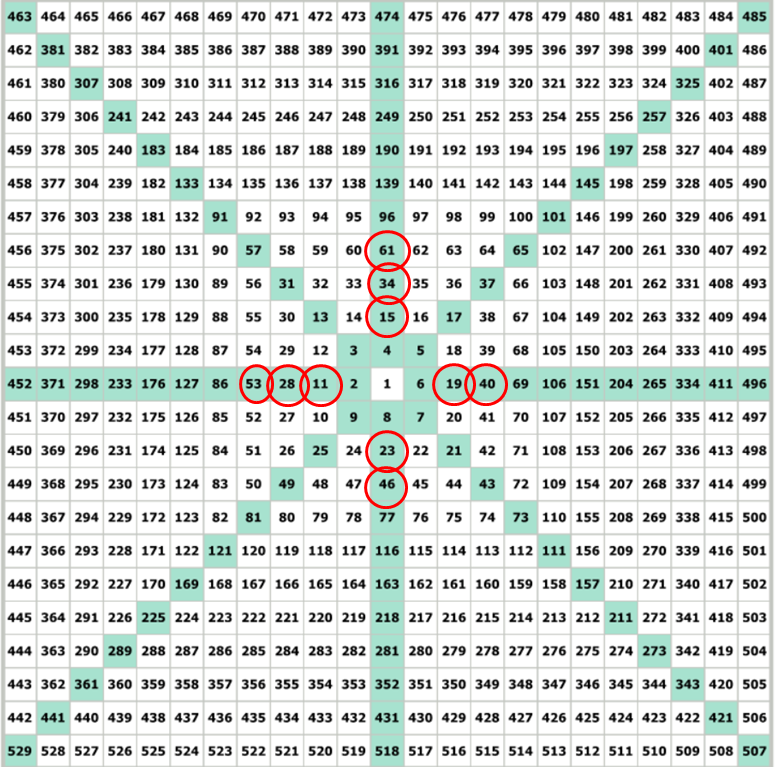
The Square of Nine chart also shows an important setup. As you know, the Square of Nine can be
used not only for price, but also for time.
The most recent S&P top occurred on June 2, 2026. If June 2 is placed in the center of the Square
of Nine and we spiral forward 13 calendar days, the count lands on the cardinal vertical cross at
point 15. That date is June 15, 2026.
This is important because cardinal and diagonal positions on the Square of Nine often mark
potential turning points. When the market reaches one of these positions at the same time other
timing tools are also active, the date becomes more significant.
May 19 Low to June 2 Top
If we measure the range from the May 19, 2026 low to the June 2, 2026 top, we get a 14-calendar-day
count. Adding 14 calendar days to the June 2 high brings us to June 16, 2026.
That creates a small square-out window surrounding June 15 and June 16. Once again, the market is
not giving us a single isolated date. It is giving us a cluster.
Additional factors also point to this same mid-June window:
- The May 14, 2026 high was 7517. Transposing 7517 to 75 degrees and using the Moon, the transiting time of six cycles — 6 x 75 degrees — arrives on June 16, 2026.
- The most recent low on June 10 was 7265. Transposing that price to 73 degrees and using the Moon’s longitude arrives at June 15, 2026.
- The Lunar Time Cycle also shows a pivot on June 15, 2026.
Squaring the Range: March 30 to June 2
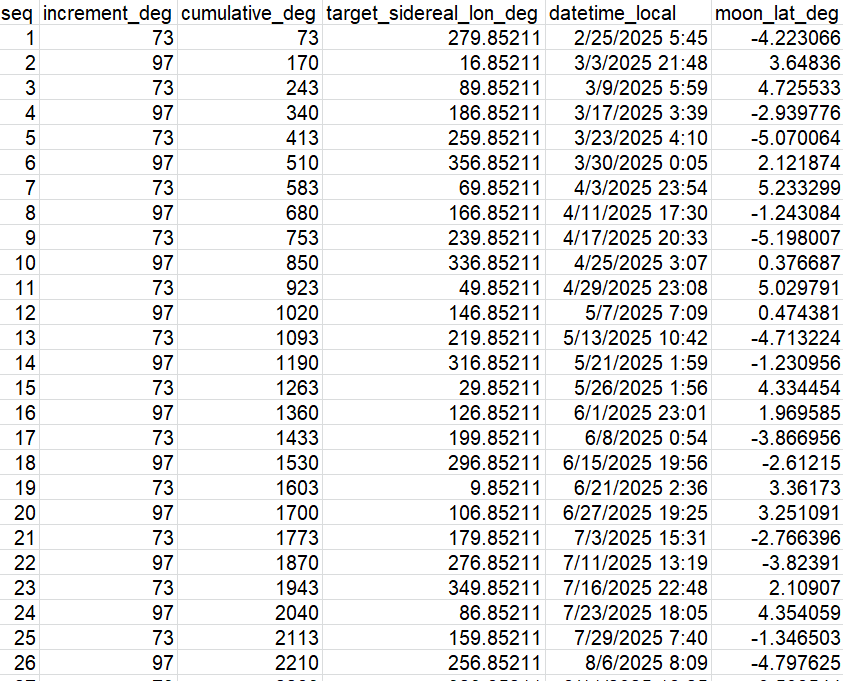
The daily squaring-the-range chart from the March 30, 2026 low to the June 2, 2026 high also
creates a series of potential pivot dates. If June 15 is acting as a high, then the next important
date to watch appears to be June 18, 2026. That could set up as a potential short-term low.

The squaring-the-range sequence produces the following potential pivot dates:
| Sequence | Potential Pivot Date |
|---|---|
| 1 | June 10, 2026 |
| 2 | June 18, 2026 |
| 3 | June 26, 2026 |
| 4 | July 4, 2026 |
| 5 | July 12, 2026 |
| 6 | July 20, 2026 |
| 7 | July 28, 2026 |
| 8 | August 5, 2026 |
June 18 Becomes the Next Date to Watch
June 18 is also supported by another square-out calculation. The March 30, 2026 low was 6359.
Taking the square root of 6359 gives approximately 80. When that value is transferred to time
and 80 calendar days are added to March 30, 2026, the result is June 18, 2026.
Now return to the Square of Nine chart with June 2 in the center. If we spiral forward 16 days
from June 2, the count lands on June 18, and that position falls on a diagonal. Diagonal positions
are also important on the Square of Nine.
There is one more confirmation. The June 2 high was 7632. Transposing 7632 to 76 degrees, then
using three cycles of 76 degrees with the Moon’s longitude, also produces a planetary square-out
on June 18, 2026.
Planetary Line and Mercury Speed Charts
The Sun planetary line chart shows price reaching resistance near the Sun’s planetary line. This
does not guarantee an immediate reversal, but it does show that price is pressing into an important
planetary resistance area at the same time the timing work is clustering.
Mercury’s longitudinal speed chart adds another timing factor. The June 15 area appears as an
important point in the Mercury speed cycle, which strengthens the case that the market is entering
a sensitive timing window.

Bottom Line
The June 15 to June 18 window is very important. June 15 shows multiple timing factors clustering
around a potential short-term high or inflection point. June 16 adds another square-out confirmation.
June 18 then becomes the next key date to watch, especially if the market begins turning down from
the June 15 area.
In addition, the declinations of Venus and Uranus cross over on June 19. Declination crossovers
often mark a change in market behavior, so this adds one more reason to pay close attention to the
entire mid-June window.
The market does not have to reverse simply because these dates are present. However, when the
Square of Nine, lunar longitude work, Fibonacci time extensions, planetary speed changes, and
planetary line resistance all begin pointing to the same narrow time period, that is exactly the type
of cluster that should not be ignored.
This market update is for educational and research purposes only and should not be considered
financial advice.