
Market Update — August 5, 2026
Review of the Previous Market Update
In our previous market update, we reached the following conclusion:
Conclusion: The combined planetary, astronomical, geometrical, and pivot-derived evidence identifies August 5–6 as the most important reversal period within the current market structure.
Figure B shows that the primary price-time square reaches completion on August 5, 2026. Because prices advanced into the completion of that square, the expectation is for some degree of price retracement to begin tomorrow and potentially continue through Monday.
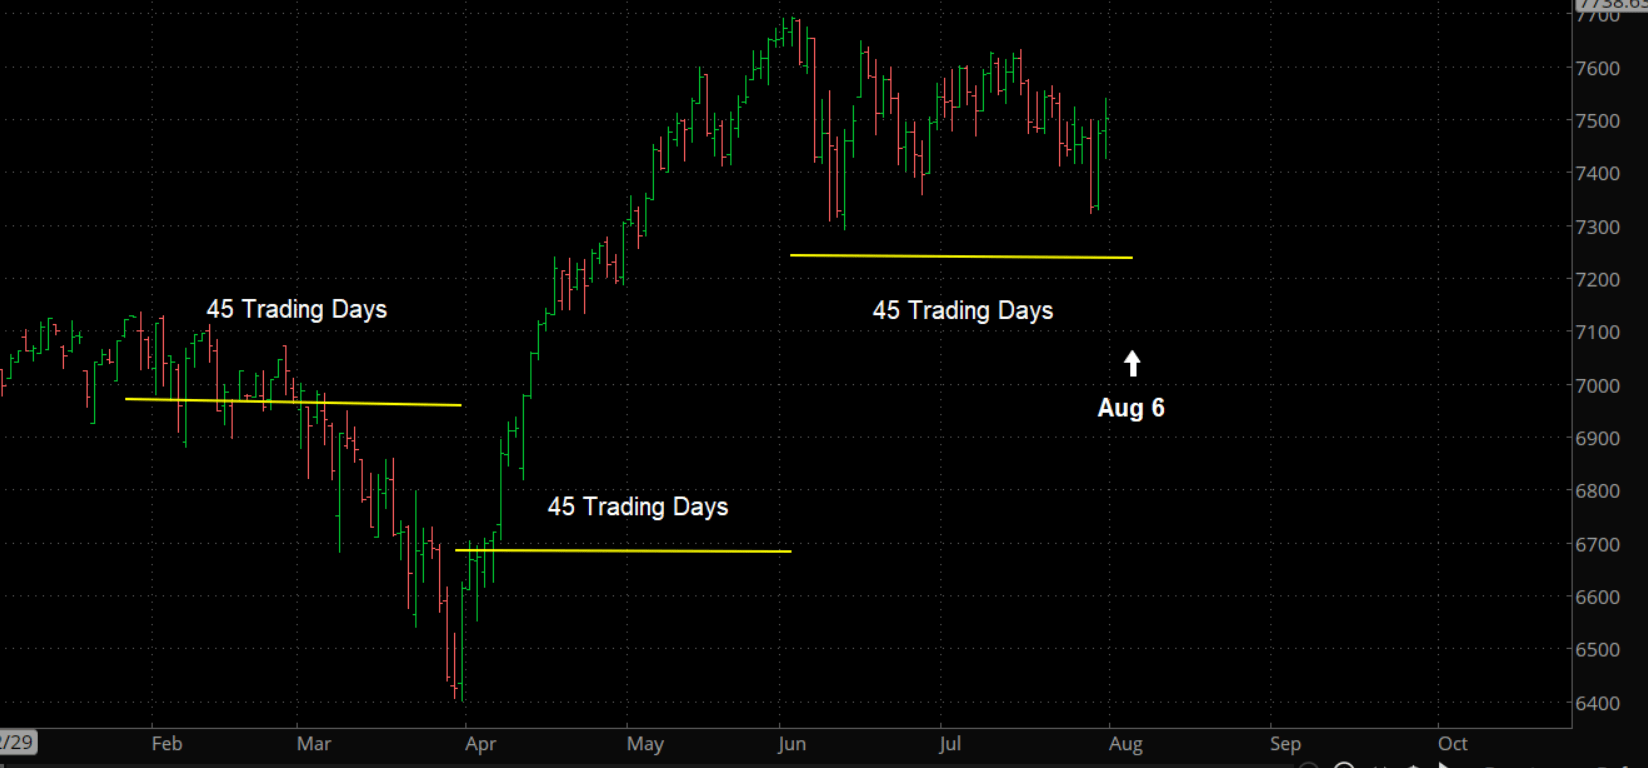
Figure A provides additional confirmation by showing that the current 45-trading-day cycle also terminates during the August 5–6 reversal window.

Geometry Derived from Market Pivots
Today’s high in the SPX was 7,793. Translating that price into longitudinal degrees produces 233 degrees, which is also a Fibonacci number.
The 233-degree position is square to 143 degrees. The 143-degree position is exactly midway between the Sun and the South Node. In addition, 143 degrees is trine, or 120 degrees, to Mercury at 113 degrees.
The July 15–July 29 Price Range
We can also examine the price range extending from the July 15 high to the July 29 low:
Price range: 268 points
Cube root of 268: 6.447
Converted to longitudinal minutes: 6,447 minutes
6,447 ÷ 60: 108 degrees
The number 108 is considered a sacred geometric number and is discussed in detail in my book. The interior angle of a pentagon is exactly 108 degrees. This geometric relationship is also associated with the architectural principles adopted by the Founding Fathers, many of whom were Freemasons.
Adding 108 degrees to the Moon’s longitude on July 29 produces a projected date of August 6.
Pivot-Derived Time Projections
June 2, 2026 High — 7,620
The price of 7,620 is reduced to 762 hours.
762 hours ÷ 24 hours = 32 days
32 days × 2 cycles = 64 days
June 2 + 64 days = August 5
June 15 High — 7,577
7.57 weeks × 7 = 53 days
June 15 + 53 days = August 6
July 6 High — 7,551
755 ÷ 24 = 31 days
July 6 + 31 days = August 6
July 15 High — 7,581
Cube root of 7,581 = 19
July 15 + 19 days = August 3
July 8 Low — 7,421
7,421 longitudinal minutes ÷ 60 = 124 degrees
124 degrees × 3 cycles, added to the Moon’s longitude, produces August 5.
July 17 Low — 7,431
Cube root of 7,431 = 19.5, rounded to 20
July 17 + 20 days = August 6
July 27 High — 7,480
7,480 expressed as longitudinal minutes:
7,480 ÷ 60 = 125 degrees
The Moon’s longitude + 125 degrees = August 6
July 29 Low — 7,313
Cube root of 7,313 = 19.41
Transforming that number into time produces 194 hours.
194 hours ÷ 24 hours = 8 days
July 29 + 8 days = August 6
Conclusion
The independent calculations derived from the June and July market pivots repeatedly converge on August 5–6. This cluster is reinforced by the completion of the primary price-time square, the termination of the 45-trading-day cycle, the 108-degree lunar projection, and the planetary geometry surrounding the SPX high of 7,793.
With prices advancing into this concentrated reversal period, the evidence continues to support the possibility of a near-term price retracement beginning within the August 5–6 window and potentially extending through Monday.
Comments
4 responses
Michael,
This is far beyond my understanding. I hope after reading your book I can better understand what you are saying. Also, I’d like to understand what actions one should take when trading the market. Is what I just read in your market update a buying opportunity or shorting opportunity. How does this tell me if the retracement is an upward move or a downward move? Next is predicting how an individual stock will move or not move.
Hi Tom,
I am expecting the market to reach a buying point on August 13. Mny astronomical phenomena come in on the 14th this Friday and up goes the market.
Hi Michael, I’m new here and very interested in learning about time cycles and market timing. Looking forward to reading your articles and learning from the community. Thank you for sharing your knowledge!
Its a lot to learn but well worth it.The book will get you there faster.Then the articles will make more sense!