
In the last market update, we identified August 12–13 as a potential market bottom and noted that our time-cycle work was projecting a buy signal. Today is August 13, and we now have additional evidence suggesting that the market is positioned to continue its rally.
Price-Time Square
Figure A shows that we have reached the very end of the first mini-square within our Gann Box. The 64-day period extending from June 2 through August 5 is divided into eight equal time segments. Market pivots have demonstrated a tendency to occur near these divisions.
The primary price-time square extending from August 5 through October 8 produces the following dates:
8/13/2026
8/21/2026
8/29/2026
9/06/2026
9/14/2026
9/22/2026
9/30/2026
10/08/2026
The first important division occurs today, August 13, adding another time component to the cluster presently developing around this date.

Figure A
Planetary Cycles and Astronomical Events
Several planetary and astronomical events are also concentrated within this same August 13–15 time period.
August 14, 2026 – Mercury Perigee
Mercury will undergo its perigee on August 14. Historically, these Mercury perigee periods appear capable of helping propel market rallies. At this point, Mercury will be at its closest position to the Sun in its orbit.
August 13 – Moon Latitude
The Moon’s latitude crosses below zero.
August 14 – Sun Latitude
The Sun’s latitude crosses below zero.
August 15 – Jupiter Conjunct Mercury
Jupiter and Mercury will form a conjunction. This planetary configuration is amplified further because the respective declinations of Jupiter and Mercury are also parallel to one another.
Heliocentric Mercury Cycle
Figure B tracks heliocentric Mercury as it advances through the zodiac in 15-degree increments. The cycle produces an important date on August 13.
Of particular interest is the alternating sequence of market highs and lows associated with each 45 degrees of longitudinal movement. Within this sequence, August 13 appears at a projected low.

Figure B
45-Degree Moon Cycle
Figure C shows the longitudinal movement of the Moon in 45-degree increments. This cycle identifies August 12 as a point of change, placing yet another cycle directly within the August 12–13 time window.
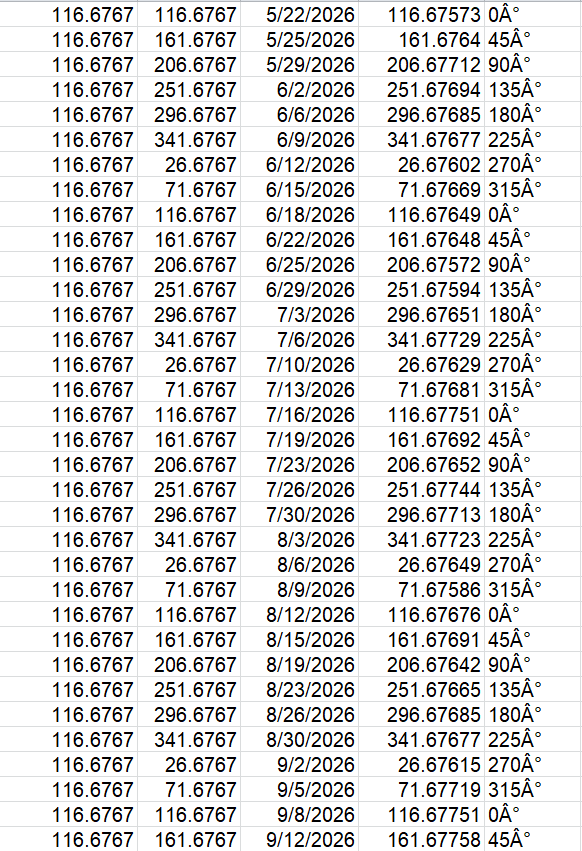
Figure C
Jupiter Leaves Combustion
Figure D illustrates Jupiter’s period of combustion extending from July 14 through August 13.
August 13 marks Jupiter’s emergence from combustion. Under this interpretation, Jupiter should now be considerably stronger, providing another factor that could support a stronger continuation of the market rally.
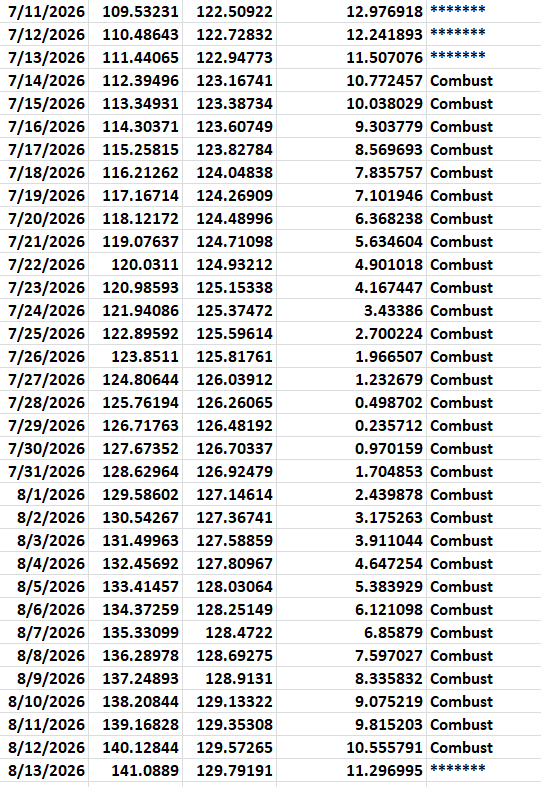
Figure D
The Lone Aviator Cycle
Figure E shows the Lone Aviator Cycle derived from W.D. Gann’s Tunnel Thru the Air. This cycle also produces a change date precisely at August 13.

Figure E
Conclusion
The concentration of independent time measurements around August 12–15 is significant. The first division of the current price-time square occurs on August 13, the heliocentric Mercury cycle projects a low on August 13, the Moon’s 45-degree cycle identifies August 12 as a point of change, Jupiter emerges from combustion on August 13, and the Lone Aviator Cycle produces another change date on August 13.
In addition, Mercury’s perigee occurs on August 14, followed by the Jupiter–Mercury conjunction on August 15, with their declinations also forming a parallel.
Taken together, these independent measurements continue to support our earlier conclusion that the August 12–13 period represents an important market bottoming window and that the time cycles are presently favoring a continuation of the rally.