
Market Update – August 2, 2026
The convergence of evidence presented below suggests that a sell signal developed on August 2, pointing to a potentially sharp downward move into August 5, followed by an upside reversal beginning on August 6.
Planetary Aspects and Cycle Changes
August 2, 2026
- The Moon’s declination moves above zero degrees.
- Mercury’s longitudinal speed reaches 59 minutes on this date.
The sensitive degrees associated with Mercury’s speed are 59 degrees and 1 degree 58 minutes. On August 2, Mercury travels a distance of 59 minutes, which is just under one full degree. Approximately one hundred years ago, George Bayer noted that these two particular longitudinal speeds frequently coincided with market reversals. Refer to Figure D.
August 3, 2026
- The longitudinal speed of the Moon’s Node changes.
August 5, 2026
- Venus and Neptune form a declination crossover.
- Venus crosses below zero degrees in declination.
- The Lunar Time Cycle shown in Figure E changes on August 5.
August 6, 2026 – A Very Important Date
- The Lone Aviator cycle shown in Figure F changes on August 6.
- The declination of the Moon’s North Node changes.
- Venus makes an ingress into Libra.
Geometrical Trading-Day Structure
The following calculations apply to the September E-mini S&P futures contract and are illustrated in Figure B:
45 trading days from January 28, 2026, to the March 31, 2026 low.
45 trading days from the March 31 low to the June 2 all-time high.
45 trading days from the June 2, 2026 high to August 5, completing the square illustrated in Figure A.
This completed geometrical sequence suggests that August 5 should mark a market low.
It is also important to recognize that the primary square shown in Figure A ends on August 5. Numerous planetary, astronomical, and geometrical changes converge around August 5 and August 6.
After that date, the primary square will simply be moved forward to the right. The next square will begin on August 5 and end on October 8, 2026. The geometry then continues to repeat.
This repeating geometry represents true market structure and continues to demonstrate that nothing in the universe—including trading markets—reveals itself randomly.
Geometry Derived from Market Pivots
June 2, 2026 High: 7,620
7,620 is reduced to 762 hours.
762 hours ÷ 24 hours = 32 days
32 days × 2 cycles, added to June 2 = August 5
June 15 High: 7,577
7.57 weeks × 7 = 53 days
June 15 + 53 days = August 6
July 6 High: 7,551
755 ÷ 24 = 31 days
July 6 + 31 days = August 6
July 15 High: 7,581
Cube root of 7,581 = 19
July 15 + 19 days = August 3
July 8 Low: 7,421
7,421 longitudinal minutes ÷ 60 longitudinal minutes = 124 degrees
124 degrees × 3 cycles, added to the Moon’s longitude = August 3
July 17 Low: 7,431
Cube root of 7,431 = 19.5, rounded to 20
July 17 + 20 days = August 6
July 27 High: 7,480
748 converts to 75 degrees.
The Moon’s longitude + 75 degrees = August 3
7,480 expressed as longitudinal minutes:
7,480 ÷ 60 = 125 degrees
The Moon’s longitude + 125 degrees = August 6
These independent calculations repeatedly identify August 3, August 5, and August 6, with the strongest concentration of evidence centered on the August 5–6 reversal window.
Market Charts and Cycle Evidence
Figure A – Primary Price-Time Square Ending August 5

Figure B – Repeating 45-Trading-Day Geometry
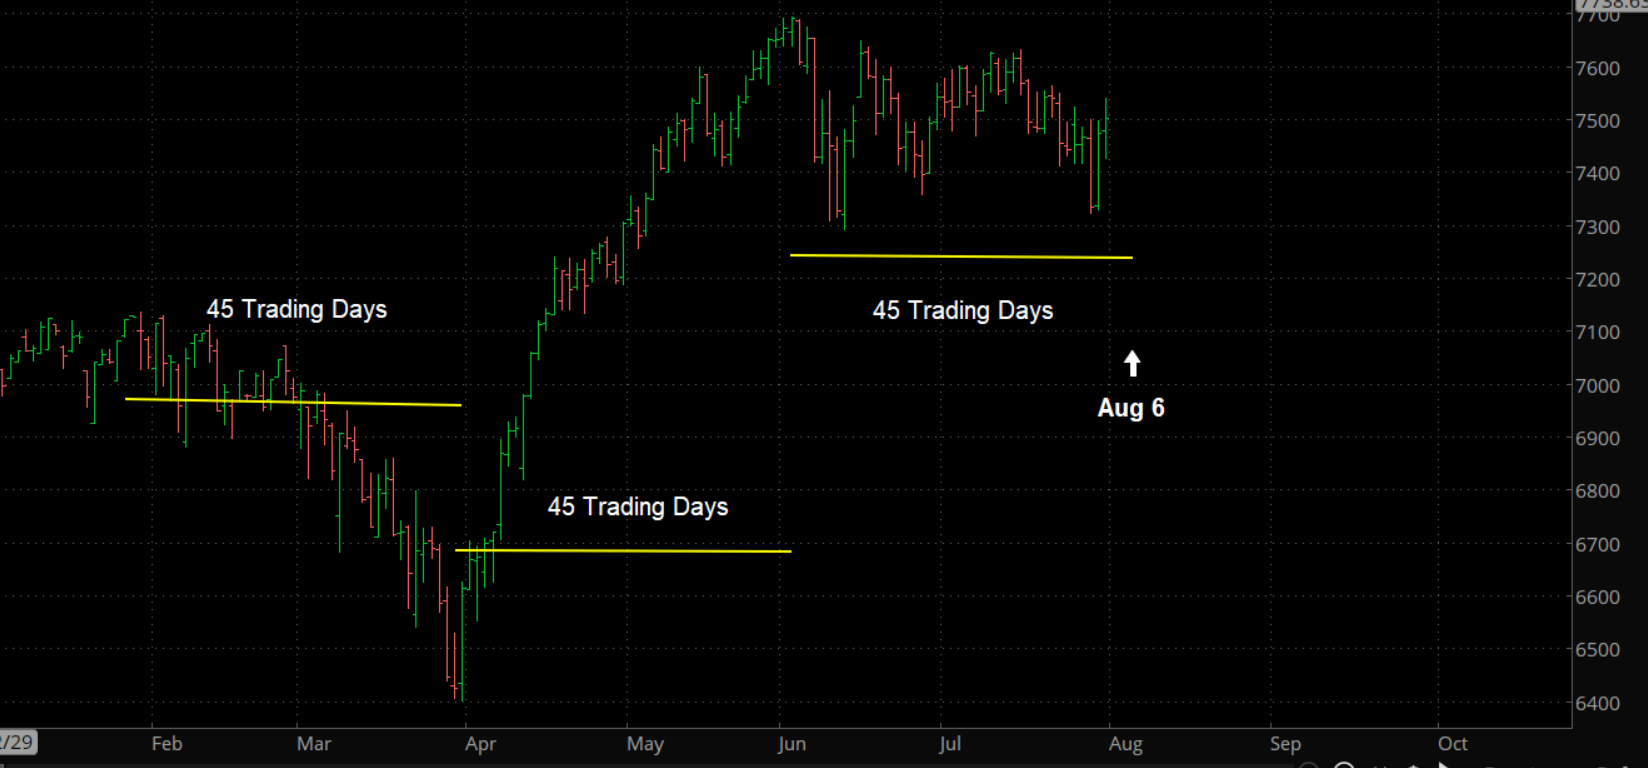
Figure C – North Node Cycle

Figure D – Mercury Longitudinal Speed for 2026

Figure E – Lunar Time Cycle

Figure F – Lone Aviator Cycle

Conclusion: The combined planetary, astronomical, geometrical, and pivot-derived evidence identifies August 5–6 as the most important reversal period within the current market structure.