
Market Update – July 5, 2026
In the last market update, we presented enough astronomical, planetary, and timing-cycle evidence to support the idea of a market reversal from the June 26 price low. The most important astronomical event in that window was Mercury turning retrograde on June 29, shown in Figure G. The Moon also reached apogee on June 28, shown in Figure F.
Now we have another timing cluster suggesting a potential market reversal beginning around July 6. I always pay close attention to what happens near the middle of a square. In this case, that also brings July 9 into focus as a possible short-term reversal point.
The Midpoint of the Primary Time-Price Square
The S&P price in Figure A is approaching the midpoint of the time-price square we have been following since June 2. Gann squares such as this are known to have their highest-energy points at the 1/4, 1/2, and 3/4 divisions of the square.
The most important point is usually the midpoint of the square, and that is where the market is standing now. The next significant point arrives near the 3/4 division of the square around July 20. After that, the 4/4 point, or the end of the square, arrives on August 5 and should also be important.
The bottom line is that the market appears vulnerable between July 6 and July 9. This is all about geometry, and from that standpoint the setup is very clear.

Figure A
Planetary Aspects and Astronomical Timing
The most important planetary aspect in this window occurred on July 4, when Mars and Uranus formed a conjunction. This adds another important timing factor directly into the same market window.
The Earth also reaches aphelion with respect to the Sun on July 6. Figure E shows the Earth at its farthest point from the Sun. My studies over the years have shown that perihelion and aphelion dates very often contribute to market reversals.
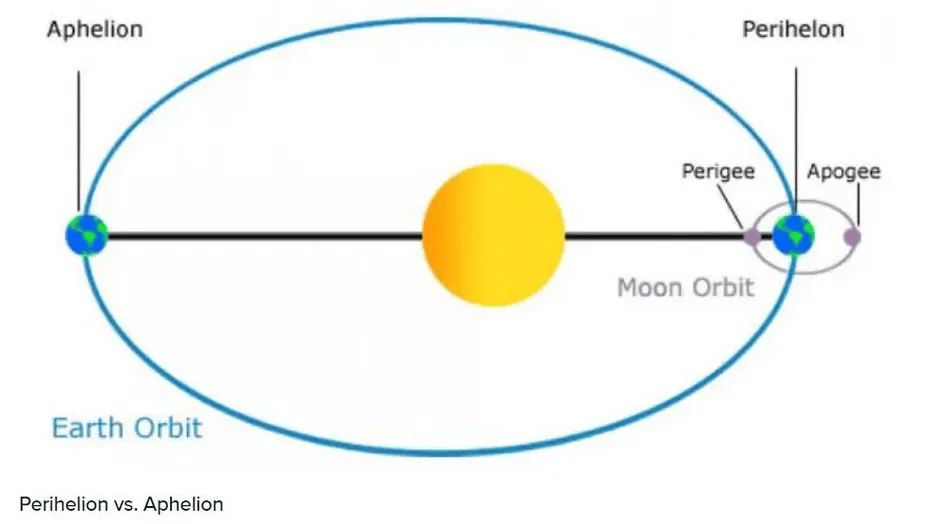
Figure E
The longitudinal speed of the Moon’s North Node, shown in Figure B, changes on July 5. This is another timing factor occurring right as the market reaches the midpoint area of the primary square.

Figure B
Figure C shows that Mercury is combust the Sun on July 5. Mercury moves out of combustion on July 21, which is especially interesting because that date aligns with the 3/4 point of the primary square.

Figure C
Figure D shows that the Moon is combust the Sun on July 13. This aligns with the 5th square of the primary square and suggests another important pivot window.

Figure D
Figure G shows the longitudinal speed of Mercury. Mercury’s speed changes on July 12, which also aligns with the 5th square in the primary square. This date is also exactly one-half of the time distance between Mercury going retrograde and Mercury going direct.
Mercury goes direct on July 24, which falls midway between the 6th and 7th square. This gives us a very tight Mercury timing structure across the July cycle window.

Figure G
Figure H, the Lunar Time Cycle, suggests a change on July 3. The next lunar timing point occurs on July 09, which is very close to the July 12 square, the 5th minor square.
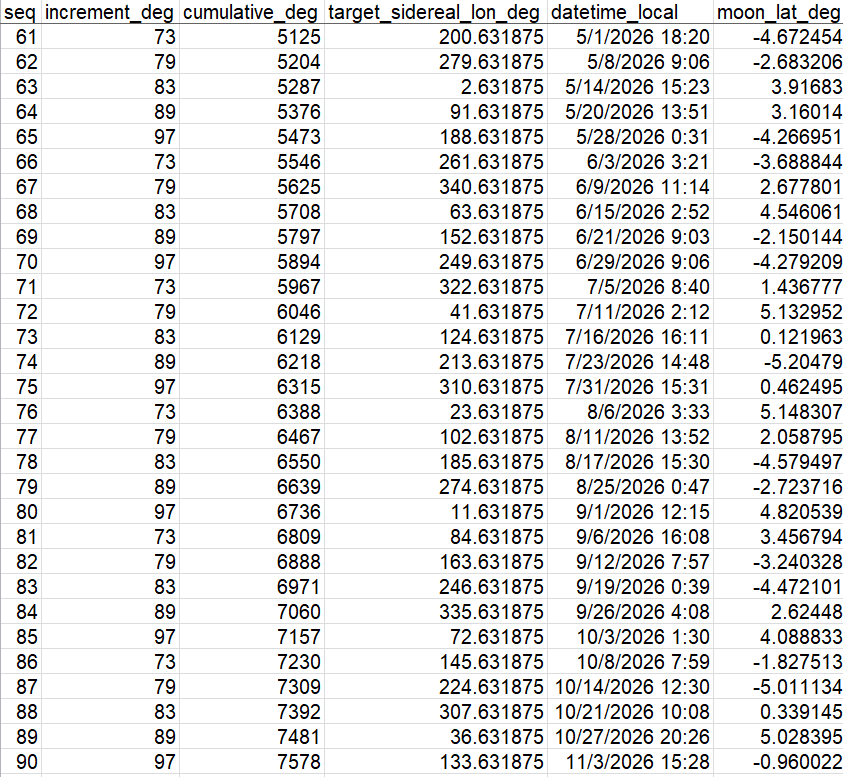
Figure H
A Rare T-Square Formation
A very unusual but important astrological chart formation now deserves attention. If we take the highest price so far (July 5th) in the E-mini S&P futures, which is 7594, and convert that price to longitude, we arrive at 32 degrees, or 2 degrees Taurus.
This is important because price is now squared with both Pluto and Jupiter, while Pluto and Jupiter are opposite each other. This type of formation is called a T-Square. In this case, price becomes the pressure point of the formation, while Pluto and Jupiter form the opposition.
A T-Square is often considered a serious reversal signature because it creates tension from three directions at the same time. When this type of formation appears at the same time as a major midpoint in a time-price square, planetary speed changes, combustion dates, and other cycle projections, it deserves serious attention.
Figure I shows this formation clearly. The current futures high of 7594 (July 5th) converts to 32 degrees, or 2 degrees Taurus, placing price square to both Pluto and Jupiter while Jupiter and Pluto are in opposition. This adds another strong warning that the market is entering a vulnerable reversal zone.
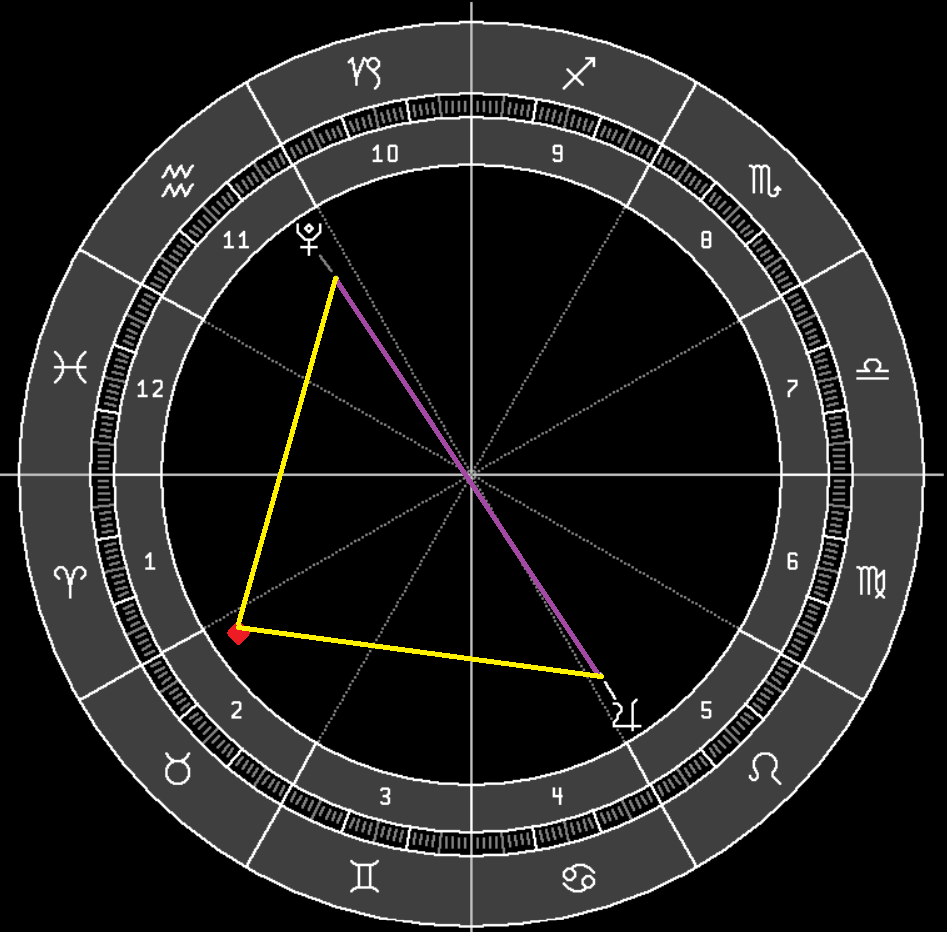
Figure I
We also have the planetary orbit of Venus. The distance from the major pivot low on November 20, 2025 to July 3, 2026 measures 225 days. That is the exact orbital period of Venus for one complete revolution.
In addition, I have used the price-time square from February 19, 2025 to April 7, 2025. That square measures 47 days. Exactly 10 cycles, or 470 days, added to the April 7 date projects to July 20. That places July 20 at the 3/4 point of the current primary square.
Moon Apogee
Figure F shows the Moon’s perigee and apogee dates. The June 28 apogee occurred directly inside the prior timing window, helping to confirm the June 26 low area that was discussed in the last market update.

Figure F
Time Pivot Cycles
The following timing projections use all planets in heliocentric mode, while the Moon is measured geocentrically.
| Pivot | Calculation | Projected Date / Meaning |
|---|---|---|
| June 2, 2026 High – 7620 | SQRT(7620) = 87 degrees Moon longitude transit: 87 degrees x 5 cycles from June 2 |
Projects to July 5, 2026, near the midpoint of the primary square. |
| June 2, 2026 High – 7620 | Moon longitude transit: 87 degrees x 10 cycles from June 2 | Projects to August 6, near the end of the primary square in Figure A. |
| Using 7620 as 76 degrees | Mercury + 2 cycles of 76 degrees | Projects to July 20, the sixth square or 3/4 point of the primary square. |
| Using 7620 as 76 degrees | Mercury + 3 cycles of 76 degrees | Projects to August 6, near the end of the primary square. |
| Using 7620 as 76 degrees | Venus + 1 cycle of 76 degrees | Projects to July 19, near the sixth square or 3/4 point of the primary square. |
| June 9, 2026 Low – 7237 | SQRT(7237) = 85 degrees Moon longitude + 4 cycles of 85 degrees |
Projects to July 5, 2026. |
| Using 7237 as 72 degrees | Moon + 5 cycles of 72 degrees | Projects to July 6, 2026, near the midpoint of the primary square. |
| Using 7237 as 72 degrees | Mercury + 1 cycle of 72 degrees | Projects to July 3, 2026, near the midpoint of the primary square. |
| June 15, 2026 High – 7577 | SQRT(7577) = 87 degrees Moon longitude + 3 cycles of 87 degrees |
Projects to July 5, 2026. |
| Using 7577 as 76 degrees | Moon longitude + 3 cycles | Projects to July 3, 2026, near the midpoint of the primary square. |
| Using 7577 as 76 degrees | Moon longitude + 6 cycles | Projects to July 19, 2026, near the sixth square. |
| Using 7577 as 76 degrees | Moon longitude + 9 cycles | Projects to August 6, 2026, near the end of the square. |
| June 26, 2026 Low – 7294 | SQRT(7294) = 85 degrees Moon + 1 cycle |
Projects to July 3, near the midpoint of the primary square. |
| June 26, 2026 Low – 7294 | Moon + 6 cycles | Projects to August 5, near the end of the primary square. |
| Using 7294 as 73 degrees | Mercury + 1 cycle | Projects to July 21, near the sixth square. |
| Using 7294 as 73 degrees | Mercury + 2 cycles | Projects to August 6, near the end of the primary square. |
| 7294 converted to minutes of longitude | 7294 divided by 60 = 120 degrees Moon + 120 degrees |
Projects to July 6, 2026. |
Summary
The market is now moving into another important timing zone. The June 26 low was supported by Mercury retrograde timing, lunar apogee, and the prior cycle cluster. The current setup now shifts attention to July 6 through July 9, where the market is approaching the midpoint of the primary time-price square.
Several independent timing factors are also lining up in this same area: the Mars-Uranus conjunction on July 4, Earth aphelion on July 6, the Moon’s North Node speed change on July 5, Mercury combust the Sun on July 5, and multiple Moon and Mercury longitude projections into July 3 through July 6.
We can now add the rare T-Square formation shown in Figure I. The E-mini S&P futures high of 7594 converts to 32 degrees, or 2 degrees Taurus. That places price square to both Pluto and Jupiter, while Pluto and Jupiter are opposite each other. This creates a serious astrological pressure pattern at the same time the market is reaching the midpoint of the primary square.
The larger square structure then points forward to July 12 and July 13 as another pivot window, followed by July 19 through July 21 near the 3/4 point of the square. The end of the primary square remains focused on August 5 to August 6.
Taken together, the market is now entering a vulnerable period. The most immediate window is July 6 through July 9, with additional pivot potential near July 12 to July 13, July 19 to July 21, and finally August 5 to August 6 at the end of the square.