Market Update – June 28, 2026
One full orbit of Mercury measures approximately 88 days. When measured from the March 30, 2026 low, that 88-day Mercury cycle completes on Friday, June 26. In my work, this type of astronomical timing event very often appears near an important market reversal.
There are several additional timing factors clustering in this same window. Figure D shows the longitudinal speed of Mercury, with Mercury moving retrograde on Monday, June 29. Figure C shows the longitudinal speed of the Moon’s North Node, which changes speed on June 27. Figure E adds another important lunar factor, showing that the Moon reaches apogee on June 28.
When several independent timing factors line up in the same narrow window, I pay close attention. The current setup is suggesting that the June 26 area may represent an important short-term pivot low.
The Measured Move
Figure B shows a geometric measured move. The move from June 2 to June 10 is equal to the move from June 15 to June 29. This is known as an AB=CD measured move. The completion of that measured move adds another piece of evidence that June 26 appears to be a low.

Figure B
The March 30 to June 2 Time-Price Square
Now let’s refer to Figure A. We created a time-price range, or square, from March 30 to June 2. This is the same square that has been used in prior posts. The square is divided into eighths in both time and price.
In the last post, I noted that June 26 would occur at the end of the 3/8 point of the square. We are now at that point, and there is a preponderance of evidence suggesting that the market can bounce from this level.
I also used Gann’s Square of Nine price chart to calculate incremental levels of every 360 degrees in the price rotation. The red horizontal lines in Figure A represent those levels. Notice how closely those red horizontal lines line up with the horizontal divisions of the time-price square.
The June 26 close came very close to the 7308 level, which appears to be an important support area. Prices should be able to rally this coming week before reaching the all-important 1/2 square, which arrives on July 6. At this point, that time frame is suggesting a potential area to look for a short setup.

Figure A
Moon Longitude Timing From the June 17 Low
There is one more timing factor that supports the idea that the current price action is occurring at a pivot point. If we take the June 17 low at 7402 and transform that into 74 degrees, two cycles of 74 degrees carry the Moon longitude to June 29, which is Monday.
The next 74-degree cycle places the Moon right on July 5. That lines up very closely with the July 6 midpoint of the time-price square, and it may be an important timing window for a short position.
Mercury Longitudinal Speed
Figure D shows Mercury’s longitudinal speed pattern for 2026. Mercury turns retrograde on June 29, adding another important timing factor to this late-June reversal window.

Figure D
Moon’s North Node Speed Change
Figure C shows the longitudinal speed of the Moon’s North Node. The speed change on June 27 occurs directly inside the same timing cluster, which adds confirmation to the June 26 through June 29 pivot window.
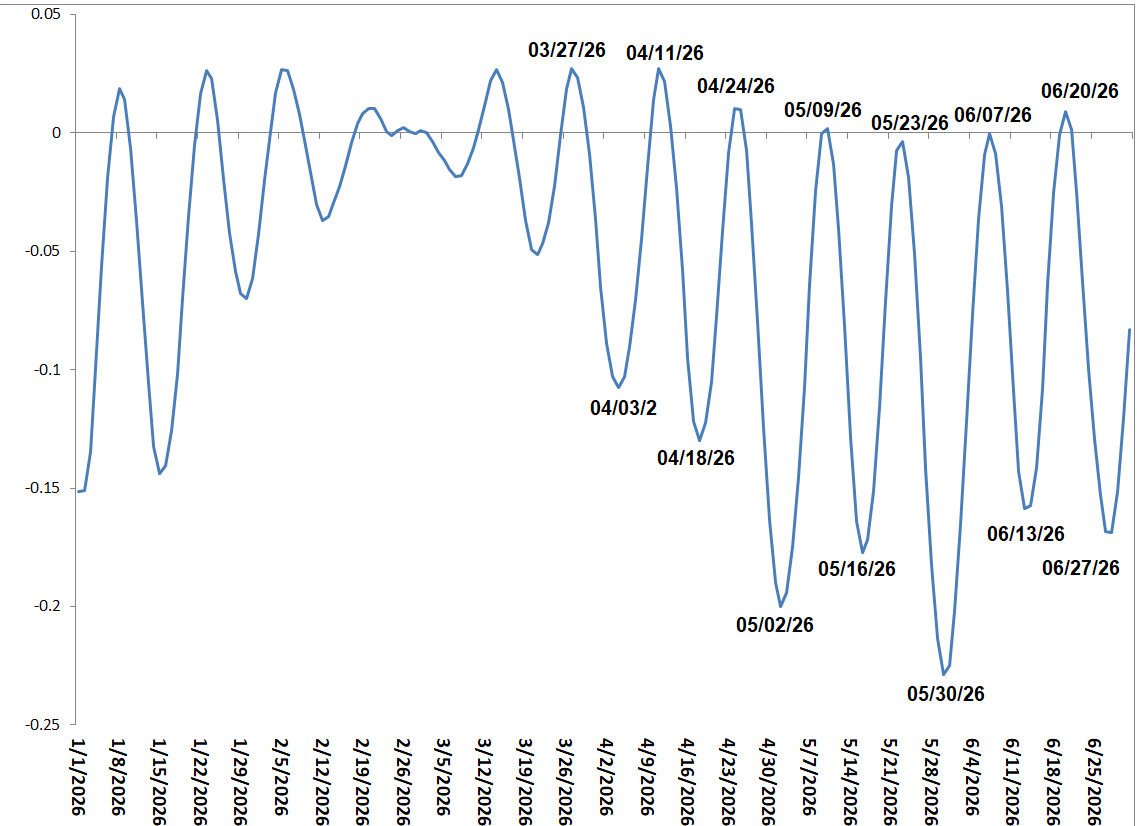
Figure C
Moon Apogee
Figure E shows the Moon’s apogee dates. The Moon reaches apogee on June 28, which falls directly between the June 26 Mercury 88-day cycle completion and the June 29 Mercury retrograde date. This creates a very tight astronomical timing cluster around the current market low.

Figure E
The 432 Hertz Power
The number 432 is not only important in acoustic theory and the so-called Solfeggio frequencies. When viewed as a pure numerical frequency, it also appears in mathematical constants, ancient architecture, time cycles, and the geometry of financial markets.
Once we remove the acoustic label of “Hertz,” meaning cycles per second, the number 432 can be studied as a harmonic number. It maps naturally into market time, price structure, circular geometry, and even the dimensions associated with the Great Pyramid.
The Great Pyramid and 432
The Great Pyramid has long been viewed as a mathematical scale model of the Northern Hemisphere of the Earth at a ratio of 1:43,200.
If the perimeter of the Great Pyramid’s base is multiplied by 43,200, the result closely corresponds to the equatorial circumference of the Earth. If the original height of the Pyramid, including the missing capstone, is multiplied by 43,200, the result corresponds closely to the polar radius of the Earth.
This is why 432 is such an important harmonic number. It is not just a sound frequency. It is also a structural number that appears in time, geometry, and ancient measurement systems.
The Geometry of 432
The number 432 is a master harmonic of the 360-degree circle and the solar time cycle. A standard day contains 86,400 seconds. One-half of that is 43,200 seconds.
In longer-term market work, 432 years or 432 months can also be used to measure major historical secular pivots. From a Gann Square of Nine perspective, 432 degrees represents one full 360-degree rotation plus an additional 72 degrees. The 72-degree extension is important because it represents one-fifth of a circle, or a quintile harmonic.
Price levels based on 432, or its multiples and divisions such as 43.2 and 4320, can also become important structural support or resistance areas. Since 432 equals 12 times 36, it combines the duodecimal system with the primary harmonics of the circle.
432 Days and the Current Market Pivot
If we measure 432 as days, the distance from the April 20, 2025 low to June 26, 2026 is 432 days. That is another reason why the current timing window appears to be at, or very near, a market pivot low for now.
There is also a lunar connection. One Moon sidereal cycle is approximately 27 days. When 432 is divided by 27, the result is exactly 16 complete cycles:
432 / 27 = 16 perfect Moon sidereal cycles
If we continue dividing 432 by 2, we arrive at several important time harmonics:
432 / 2 = 216
216 / 2 = 108
108 / 2 = 54
54 / 2 = 27
The final harmonic is 27, which brings us directly back to the Moon’s sidereal cycle. This reinforces the idea that 432 is not an isolated number. It is part of a larger harmonic structure that connects time, price, circular geometry, and lunar motion.
Summary
The market is currently sitting inside a very important timing cluster. The 88-day Mercury orbit from the March 30 low completed on June 26. The AB=CD measured move also points into this same window. The Moon’s North Node speed changes on June 27, the Moon reaches apogee on June 28, and Mercury turns retrograde on June 29.
At the same time, June 26 falls at the 3/8 point of the March 30 to June 2 time-price square and lands very close to the 7308 support level. The 432-day count from the April 20, 2025 low also terminates on June 26, adding another major harmonic to this setup.
Taken together, the evidence suggests that the market is at or very near a short-term pivot low. The expectation is for a rally into the coming week, with the July 5 to July 6 window becoming especially important as price approaches the midpoint of the time-price square.