
Market Update — May 29, 2026
This could be more than just an ordinary pivot point. What I am referring to is the squaring of the range from the January 28, 2026 high to the March 30, 2026 low. I have been watching this range of time for several weeks because the time structure has continued to build toward May 29, 2026.
The rectangular square I am watching covers a range of 61 calendar days. The end of this primary square arrives on May 29, 2026. At that point, time and price are approaching a square-out condition.

Square of Nine Time Dates
INSERT HERE
I previously introduced the Square of Nine, which is primarily used to measure price in terms of angular degrees. In this case, I am applying the same concept to time. I took the March 30 low and placed that date at the origin. From there, I treated each number on the Square of Nine as a calendar day forward from the origin.
As the count moves clockwise, I marked the days that landed on either the cardinal cross or the diagonal lines. These are normally the higher-energy locations on the wheel, where pivots and reversals are more likely to occur. Notice that on Friday, May 29, 2026, the 61st day lands directly on the cardinal cross.
That is important because this marks the end of the first time square. From here, the same square can be shifted forward. The next square begins from May 29, 2026, and the same process will be repeated.

Square of Nine Time Dates
Below is the table of dates from the March 30 origin where the calendar count landed on either the cardinal cross or the diagonals:
| Day Count | Date |
|---|---|
| 11 | April 9 |
| 13 | April 11 |
| 15 | April 13 |
| 17 | April 15 |
| 19 | April 17 |
| 21 | April 19 |
| 23 | April 21 |
| 25 | April 23 |
| 28 | April 26 |
| 31 | April 29 |
| 34 | May 2 |
| 37 | May 5 |
| 40 | May 8 |
| 43 | May 11 |
| 46 | May 14 |
| 49 | May 17 |
| 53 | May 21 |
| 57 | May 25 |
| 61 | May 29 |
Fibonacci Time Clustering
We also have several Fibonacci time relationships clustering between June 1 and June 6. This adds another layer of timing pressure immediately after the May 29 square-out date.
December 17, 2025 low to March 30, 2026 low = 104 days
104 × 1.618 = June 3, 2026
January 28, 2026 high to March 30, 2026 low = 61 days
1 × 61 = June 1, 2026
October 8, 2025 to March 30, 2026 = 174 days
174 × .382 = June 6, 2026
November 20, 2025 to March 30, 2026 = 131 days
131 × .5 = June 5, 2026
When several different timing methods point to the same general window, that window becomes much more important. The May 29 to June 6 period is therefore a timing zone that deserves close attention.
Planetary Timing Factors
The chart below shows the longitudinal speed of the Moon’s North Node changing on May 29. This is occurring at the same time the Square of Nine time count is reaching the 61-day square-out point.

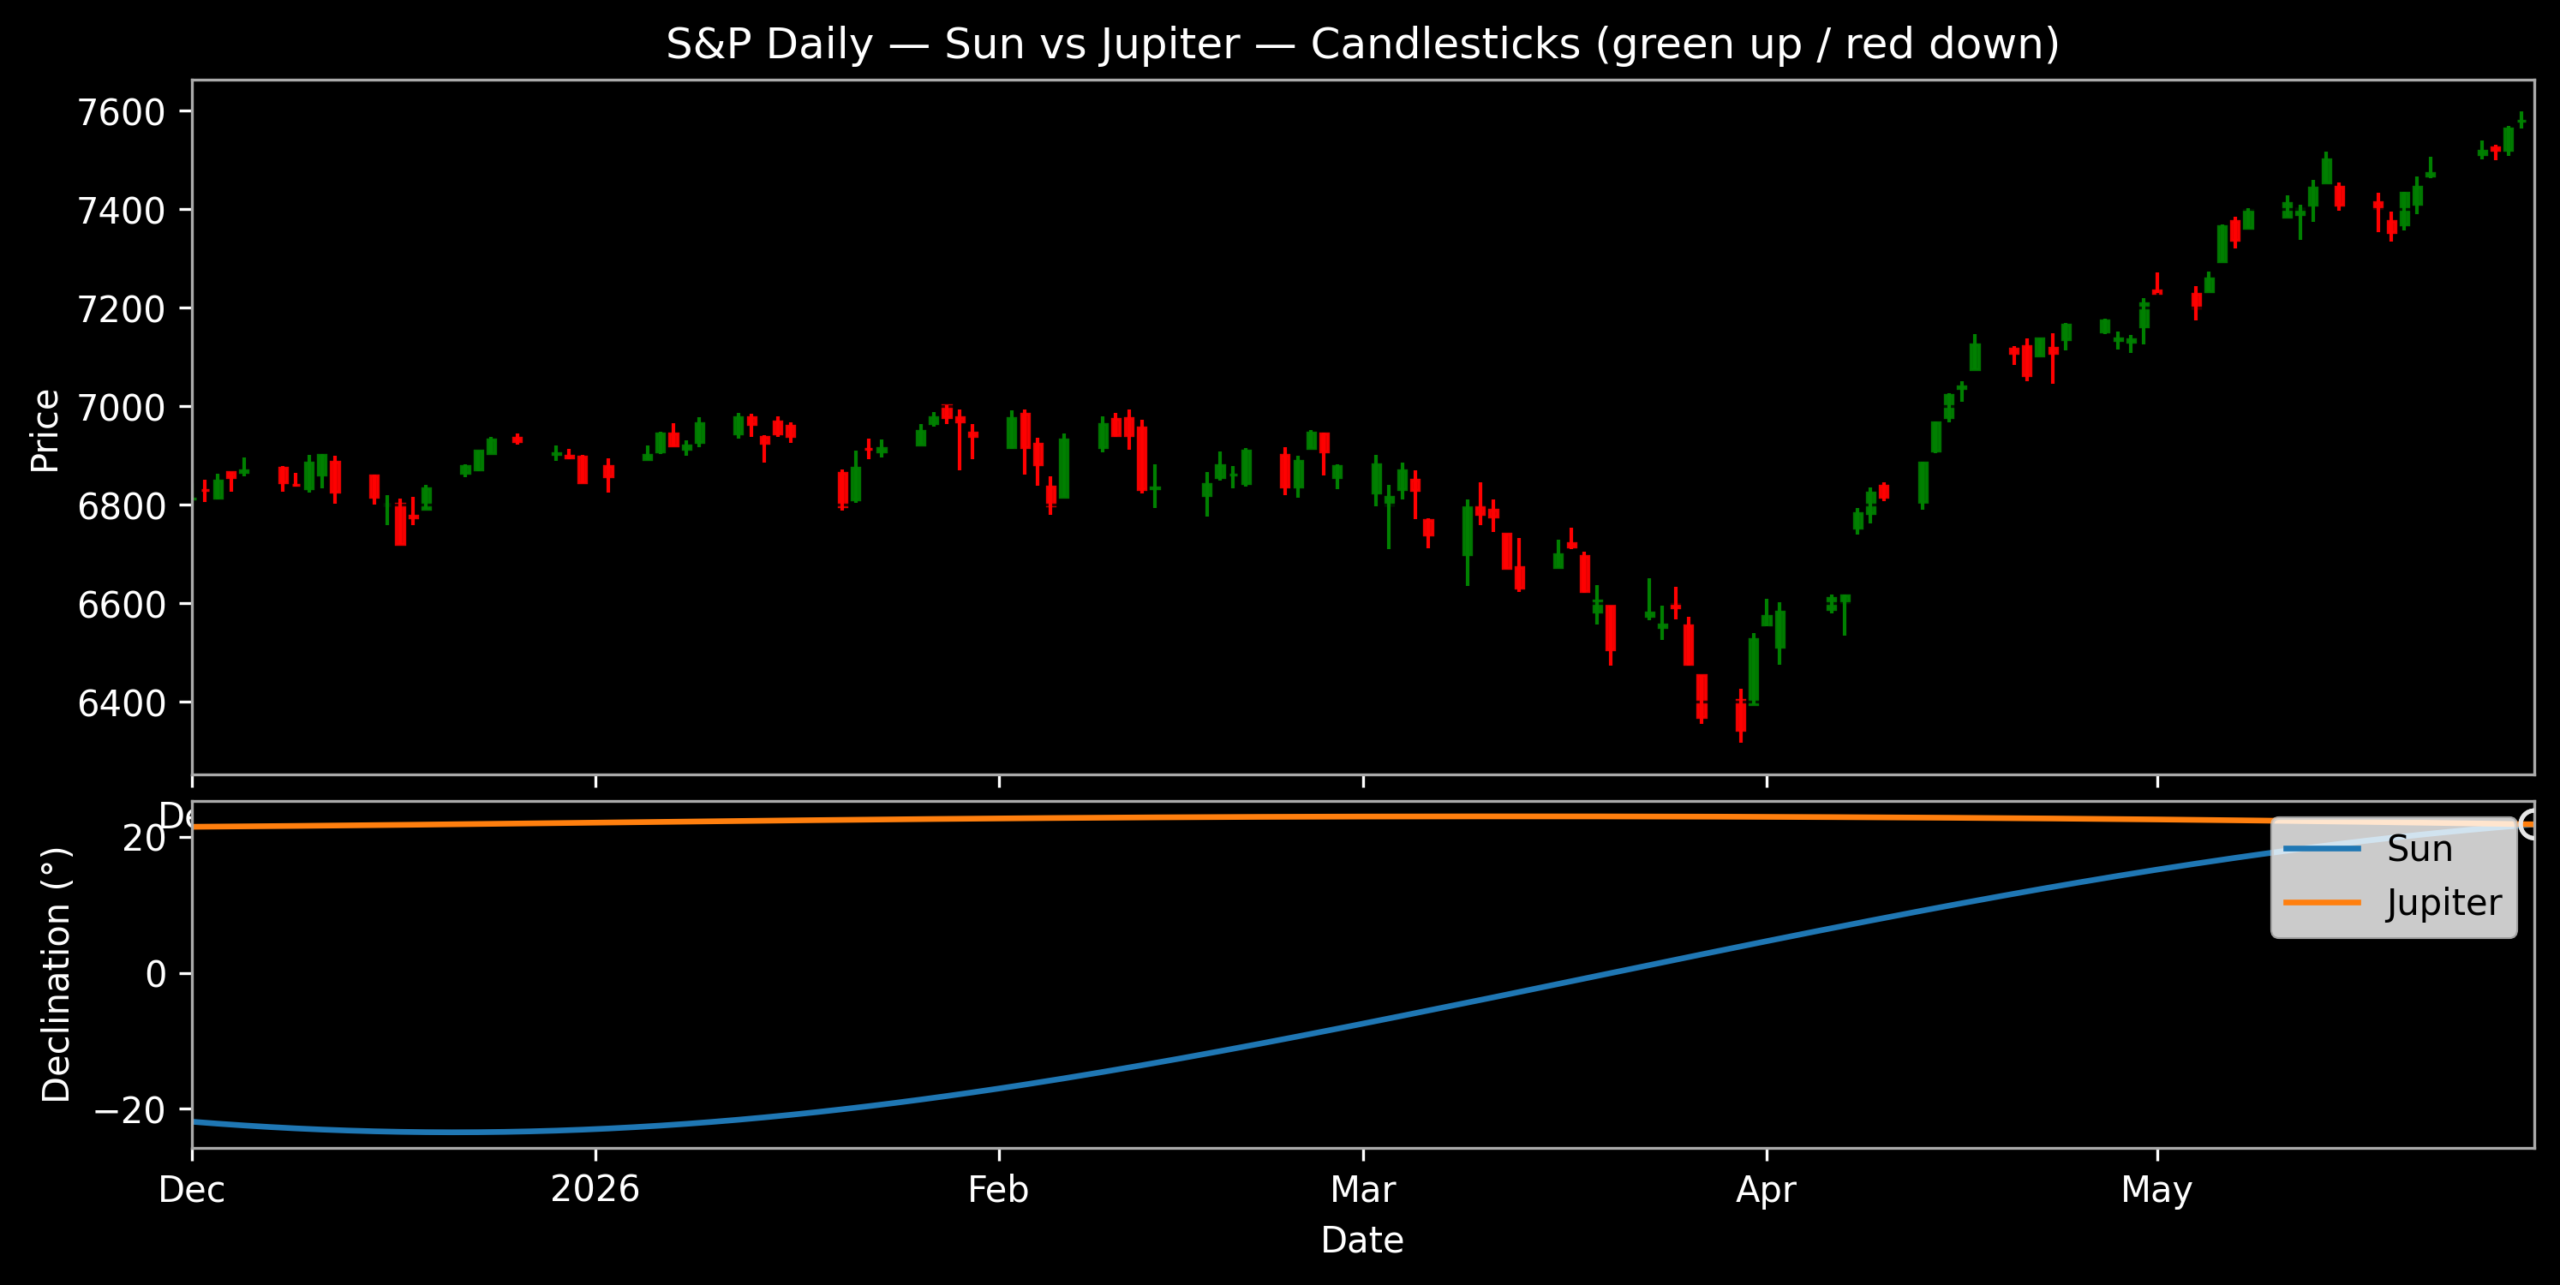
In addition, the Sun and Jupiter have a declination crossover on May 30. Declination crossovers often accompany market reversals, especially when they appear near other important timing dates.
On May 31, both the Moon and the Sun also have latitude changes. This gives us a very tight cluster of planetary timing factors surrounding the May 29 square-out date.
Uranus and Price at Resistance
Below is the planetary trend line of Uranus and price. On May 29, price moved directly into the Uranus planetary trend line resistance area. This is bearish, especially when combined with the Square of Nine time count, the Fibonacci time cluster, the Moon’s North Node speed change, and the Sun-Jupiter declination crossover.

Final Thoughts
The main point is that May 29, 2026 is not standing alone. It is being confirmed by several independent time and planetary measurements. The 61-day square from the March 30 low completes on May 29. The Square of Nine places that same count directly on the cardinal cross. Fibonacci time measurements are clustering immediately afterward between June 1 and June 6. At the same time, the Moon’s North Node, the Sun, Jupiter, the Moon, and Uranus are all contributing additional timing pressure.
This does not guarantee an immediate reversal, but it does tell us that the market has entered a very important time-price resistance zone. From this point forward, the market’s behavior should be watched very carefully for signs of a turn.