
Market Pivot Commentary
Monday, April 6, suggests a market reversal or pivot day. Pluto and Venus are in a square aspect on Friday, April 3. The last two pivot lows, March 20 and March 30, are 10 calendar days apart. If that same 10-day interval is added to the March 25 pivot high, which lies between those two lows, the result is April 4 as the next projected pivot high.
The Moon’s Node changes longitudinal speed on April 4, and the composite declination of the Sun and Mercury crosses the zero axis on April 5. This combination occurred only once between January 1 and July 1. The plot of the Moon’s Node longitudinal speed has been remarkably accurate at identifying pivot points in the S&P market.
My proprietary cycle, which will be described in my forthcoming book, also points to Monday, April 6, as a pivot date.
The last pivot low in the S&P was made on March 30 at 6316. Converting that price to 63.16 degrees, and using the geocentric Moon longitude of 157 degrees on that date, gives 220 degrees when rounded and added together. The Moon reaches that longitude on April 4.
Another technique is to take the square root of the pivot price. The square root of 6316 is approximately 80. Treated as longitude, and added to the Moon’s 157 degrees, the result is 237 degrees. The Moon crosses that longitude on April 6.
A third method is to treat 6316 as minutes. Because there are 1,440 minutes in a day, 6316 divided by 1440 equals about 4.4 days. That projection points to Friday, April 3, suggesting some type of high.
On January 12, a pivot high was made at 6986. Its square root is 84. Since this work is always centered on time, that number can be interpreted as 84 hours, 84 days, 84 months, or even 84 years. Future pivots can unfold within any of those time frames. Adding 84 days to January 12 brings us to April 6.
The longitudinal speed of Mercury, shown in the chart below, changes speed on April 3, 2026. On that day Mercury traveled only 59 minutes of arc, just short of 1 degree. In my work, that type of slowdown has repeatedly aligned with market reversals.
Finally, the Perigee/Apogee chart below marks April 7 as a highly important Apogee date, implying a possible change in trend from the current upward move. NASA selected Apogee timing for Moon missions because it places the Moon at its farthest distance from Earth, allowing a spacecraft to benefit from the Moon’s slingshot effect. In fact, this table has identified every major pivot in Bitcoin over the last two years. The table is publicly available through Google or NASA. I do not regard this as coincidence. I view it as planetary influence expressing itself through human behavioral patterns. The Moon exerts a powerful influence on all of us.
The chart below, the Jupiter Planetary Line, shows how S&P prices are meeting resistance when Jupiter’s longitude is converted into price. Notice that the Japanese candlestick on the far right has formed a bearish Hanging Man pattern, implying a possible top.
I also developed a new software package this past weekend, and it is already near the top of all my software tools. I call it the Future Longitude Date Finder. For one test, I selected February 11, 2026, a pivot high of 6993 in the S&P. I then converted that price into 699 degrees of longitude, although 69 degrees could also have been used. Next, I applied it to the Moon, which is the fastest-moving body relative to the planets, and ran three cycles of 699 degrees. After clicking calculate, the future box displayed three dates: April 7, June 1, 2026, and July 21, 2026. All of those dates are now embedded in my future cycle work.
I will explain the details in my book, and I will be adding this tool shortly to the Software Store. The bottom line is this: the most important aspect of my longitudinal theory is that each pivot point appears to contain a kind of DNA code for future timing. It remains a mystery to me, but it seems to reflect the collective consciousness of traders and to become encoded into the price structure of pivot points. It is a method that can project future pivots well ahead of most traders.

Jupiter Planetary Line
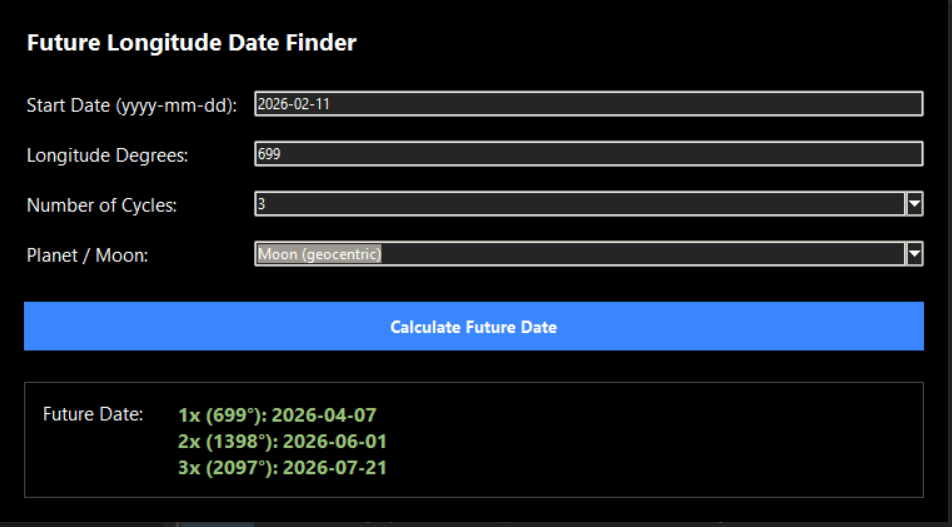
Future Longitude Date Finder

S&P 500 Cash

Moon’s True Node Longitudinal Speed

Sun-Mercury Declination Composite

Longitudinal Speed of Mercury
